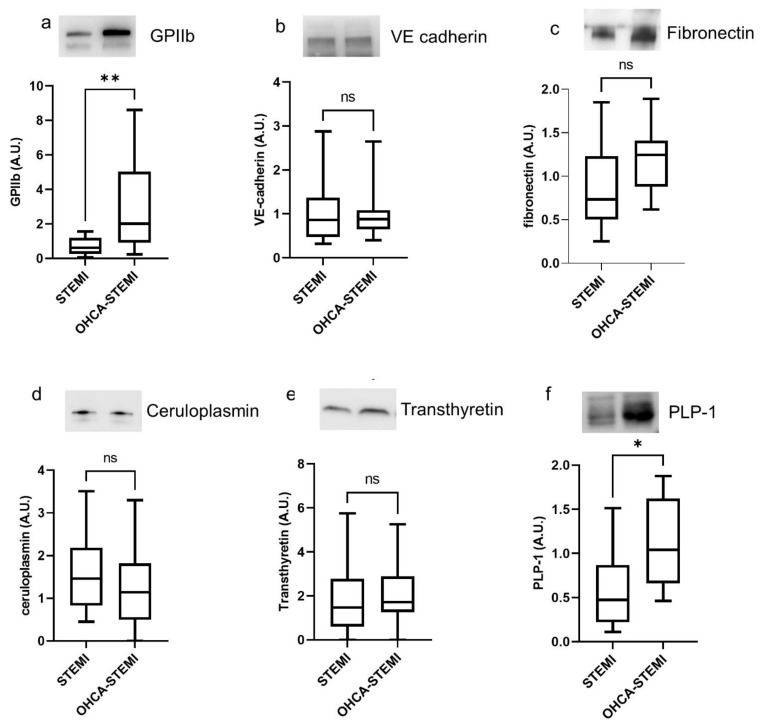
Figure 4.
Plasma exosomes of OHCA-STEMI patients display a greater expression of platelet and brain-associated markers. (a–f) Densitometric quantification and representative images of Western blot analysis of GPIIb (a), VE-cadherin (b), fibronectin (c), ceruloplasmin (d), transthyretin (e) and PLP1 (f). For each box plot, the center line illustrates the median and box limits indicate the 25th and 75th percentiles. ns: not significant, * p < 0.05, ** p < 0.01.

