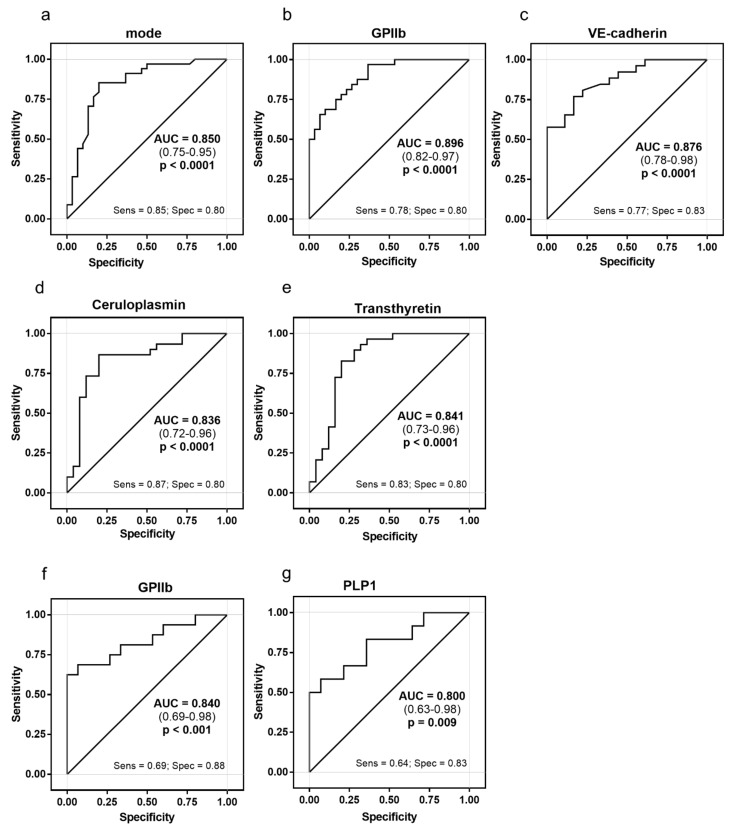
Figure 5.
ROC curve analysis of exosomes versus cardiovascular clinical manifestation. Receiver operating characteristic (ROC) curve analysis was used to evaluate the ability of exosome to discriminate between STEMI (overall) and CCS patients (a–e) and between OHCA-STEMI and uncomplicated STEMI (f,g) in terms of dimension (mode) (a), GPIIb (b–f), VE-cadherin (c), ceruloplasmin (d), transthyretin (e) and/or PLP1 (g). Areas under the curve (AUCs), p values for AUC differences, cut-off values, sensitivity, and specificity are reported.

