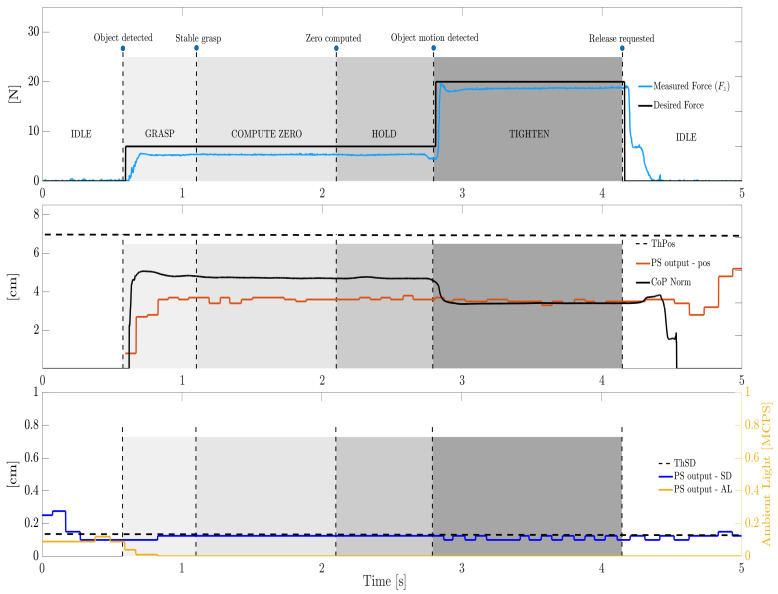
Figure 14.
Representative trial on the soft cylinder, rotational slip. The top subplot shows the desired and grasping forces, whereas the mid subplot shows the CoP variation together with the PS distance. The bottom subplot shows the AL and SD characterizing the PS signal. For the sake of clarity, labels of transitions and states are reported only in the top subplot whereas only some of the thresholds are plotted.

