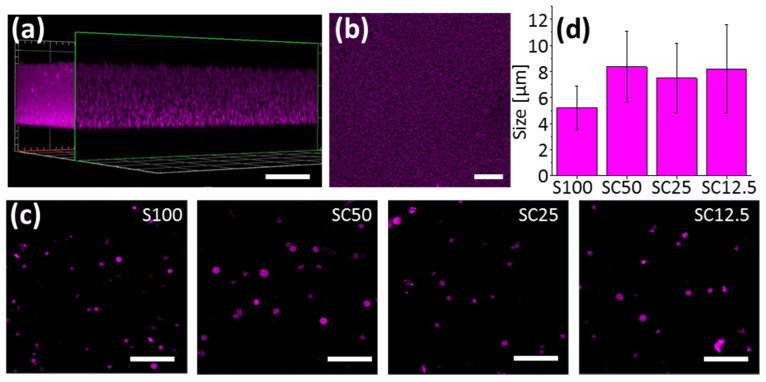
Figure 2.
Characterization of bulk hydrogels and microgels. Images in (a,b) show representative fluorescence micrographs of S100 hydrogel produced by polymerization of 50 µL polymerization mixture in a microplate well: (a) 3D reconstruction and (b) top view; scale bars are 50 µm. The Images in (c) show representative fluorescence micrographs of microgels produced from S100, SC50, SC25 and SC12.5 in a water-in-oil emulsion. Scale bars are 50 µm. The histogram in (d) shows the average size of S100, SC50, SC25 and SC12.5 microgels, determined by microscopy. Error bars indicate standard deviations (n > 120).

