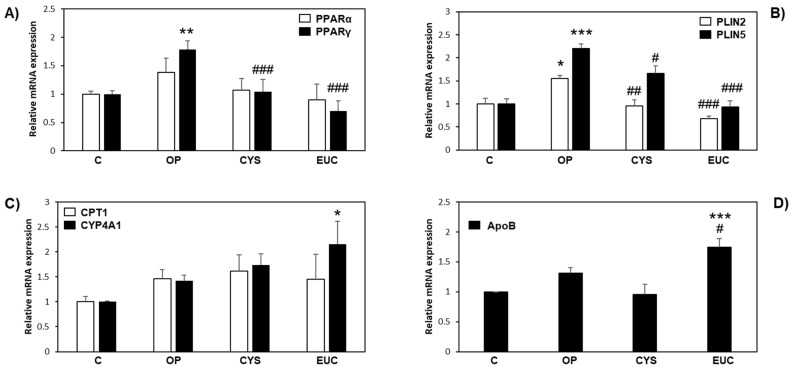
Figure 4.
Effects of CYS and EUC on hepatic gene expression. The relative mRNA expression of (A) PPARα and PPARγ, (B) PLIN2 and PLIN5, (C) CPT-1 and CYP4AA1 and (D) ApoB was quantified by qPCR in control (C) and steatotic FaO cells incubated in the absence (OP) or in the presence of CYS or EUC 50 µg/mL for 24 h. Data are expressed as fold induction with respect to controls. Values are mean ± S.D. from three independent experiments. Significant differences are denoted by symbols: * p ≤ 0.05, ** p ≤ 0.01, *** p ≤ 0.001 vs. C; # p ≤ 0.05, ## p ≤ 0.01, ### p ≤ 0.001 vs. OP.

