Figure 5.
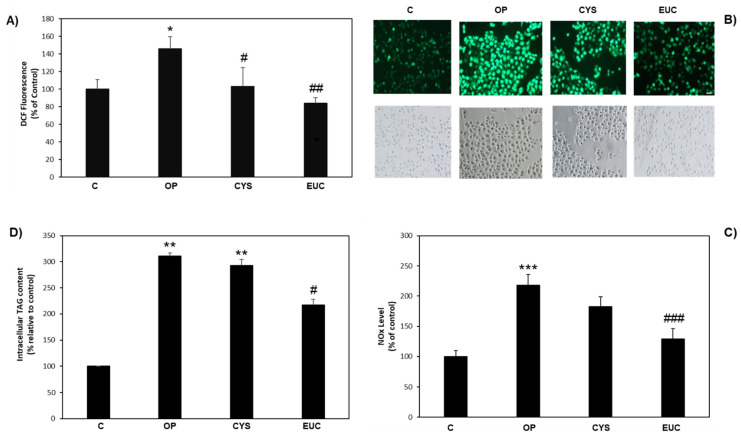
Effects of CYS and EUC in steatotic HECV cells. HECV cells were incubated in the absence (OP) or in the presence of 50 μg/mL CYS or EUC for 24 h. (A) Spectrofluorometric quantification of DCF fluorescence. (B) Representative images of DCF fluorescence quantified in (B) (magnification 10×; bar 50 μm). (C) NOx production measurements. (D) Intracellular TAG content assay. Data are expressed as percentage relative to control. Values are mean ± S.D. from three independent experiments. Significant differences are denoted by symbols: * p ≤ 0.05, ** p ≤ 0.01, *** p ≤ 0.001 vs. C; # p ≤ 0.05, ## p ≤ 0.01, ### p ≤ 0.001 vs. OP.

