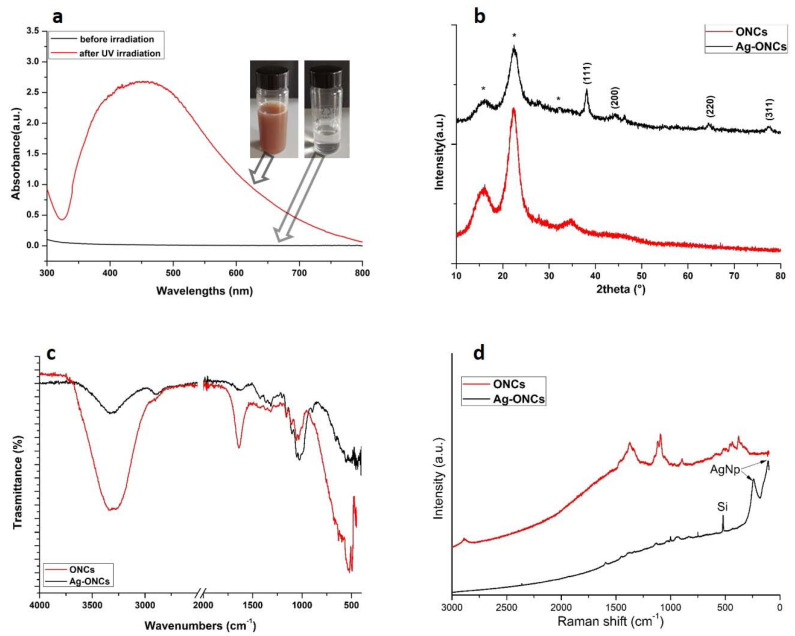
Figure 1.
Comparison between for ONCs and Ag–ONCs: (a) UV–Vis before and after UV irradiation (b) X-ray diffraction (XRD), (c) Attenuated Total Reflectance Fourier Transform Infrared (ATR–FTIR), and (d) Raman spectra. Note that the * in (b) are referred to the XRD cellulose peaks in the nanocomposite.

