
Figure 7.
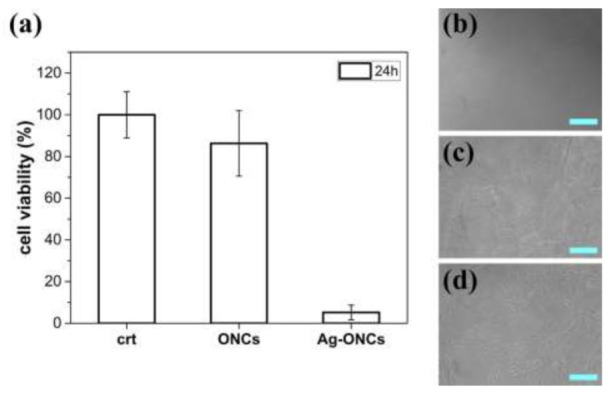
(a) Cell viability of NIH-3T3 cells after 24 h of exposure to Ag–ONCs or ONCs and without any NP treatment (crt). Data are presented as mean ± standard deviation (SD). Optical micrographs of NIH-3T3 cells treated with (b) Ag–ONCs or (c) ONCs and (d) without any NP treatment after 24 h of incubation (Scale bar = 100 µm).