Figure 3.
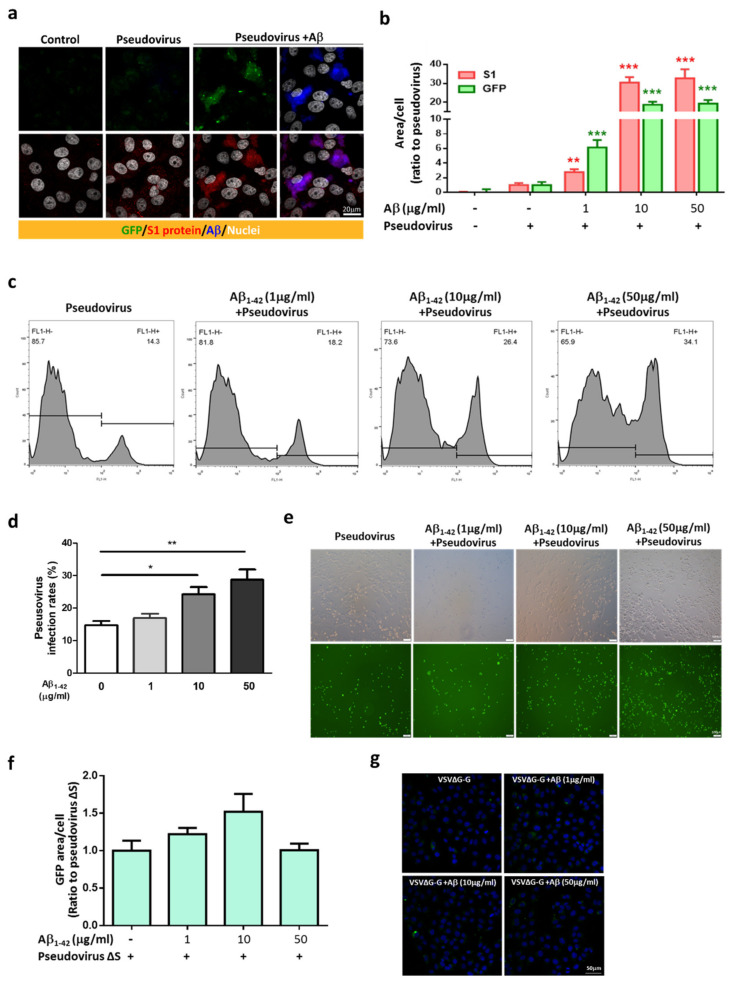
Aβ1-42 increases the infectivity of SARS-CoV-2 pseudovirus. (a) GFP fluorescence of SARS-CoV-2 (green, upper panels) and immuno-reactivity of the S1 of SARS-CoV-2 (red, lower panels) were barely detected 2 h post-infection in Vero E6 cells with vehicle (control) or SARS-CoV-2 pseudovirus alone (pseudovirus), which were robustly elevated in the infected cells with Aβ1-42 treatment (pseudovirus+Aβ). Intriguingly, Aβ1-42 (blue) was co-localized with the immuno-reactivity of the S1 of SARS-CoV-2 (shown as purple in right lower image). Scale bar: 20 μm. (b) Quantification of GFP fluorescence and the S1 immuno-reactivity in Vero E6 cells with viral infection and Aβ1-42 treatments is shown. Aβ1-42 (1 µg/mL) significantly increased GFP expression (6.15 ± 1.02-fold increase compared to the control, p < 0.001) and S1 immuno-reactivity (2.77 ± 0.41-fold increase compared to control, p < 0.01). Further increases in GFP expression and S1 immuno-reactivity were found at 10 µg/mL (18.71 ± 1.58-fold increase compared to the control, p < 0.001, and 30.41 ± 2.91-fold increase compared to control, p < 0.001, respectively) and 50 µg/mL of Aβ1-42 (19.3 ± 1.88-fold increase compared to the control, p < 0.001, and 32.69 ± 4.79-fold increase compared to the control, p < 0.001, respectively). (c) Representative histograms of flow cytometry indicated that Aβ1-42 (1 to 50 µg/mL) increased GFP fluorescence (% total counts) in cells. (d) Quantification of the viral infectivity from flow cytometry is presented as infection rates (%, for details, please see Materials and Methods). The infection rates for cells treated with Aβ1-42 at doses of 1, 10, and 50 µg/mL were 16.87% ± 1.32% (ns), 24.22% ± 2.24% (* p < 0.05), and 28.7% ± 3.2% (** p < 0.01), respectively, compared to the controls (14.65% ± 1.32%; n = 6 per group). (e) Representative photomicrographs of phase contrast (upper panels) and fluorescent images (lower panels) are presented. Scale bars: 100 μm. (f) Viral infectivity of pseudovirus VSVΔG-G was measured by total GFP fluorescence with DAPI by confocal microscopy in Vero E6 cells. Treatment with Aβ1-42 (0, 1, 10, 50 µg/mL) did not significantly increase viral infection of pseudovirus VSVΔG-G in Vero E6 cells after a 2 h incubation (p = 0.0571). (g) Representative confocal images indicated that the expression of GFP was minimal after co-treatment with pseudovirus VSVΔG-G and Aβ1-42. Scale bar: 50 μm.

