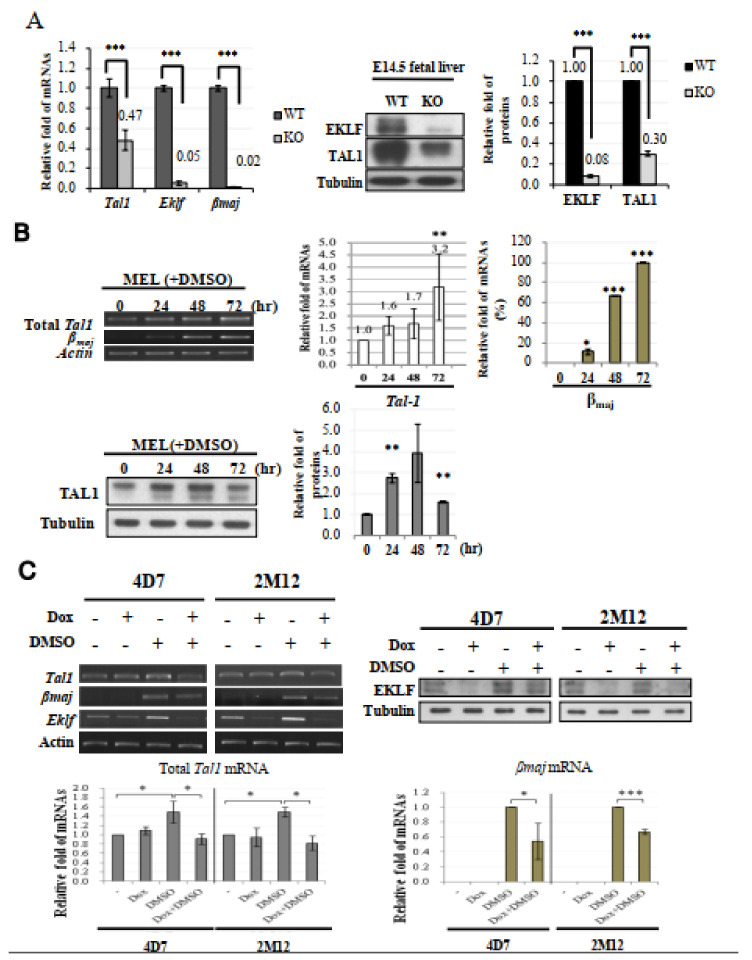
Figure 3.
Tal1 as a direct target gene of EKLF. (A) Left, bar diagram of the relative mRNA levels of Tal1, Eklf, and βmaj in E14.5 fetal liver cells of the WT and Eklf−/− (KO) mice, as analyzed by RT-qPCR. *** p < 0.001 by t test. Error bars, SEM. Middle panels and right histobar diagram, Western blotting analysis of TAL1 and EKLF in the E14.5 fetal livers of WT and Eklf−/− (KO) mice. Tubulin was used as the loading control. *** p < 0.001 by t test. Error bars, STD. (B) Top, expression levels of Tal1 and βmaj in MEL cells without or with DMSO induction for 72 h. The gel patterns of the semi-quantitative RT-PCR bands are shown on the left, and the histographs of the statistical analysis of the data are shown on the right. * p < 0.05, ** p < 0.01, and *** p < 0.001 by t test. Error bars, SD. Bottom, Western blotting analysis of the levels of the TAL1 protein in MEL cells during DMSO-induced differentiation. Tubulin was used as the loading control. The statistical analysis of the data is shown in the bar diagrams on the right. ** p < 0.01 by t test. Error bars, SD. (C) Analysis of the gene expression in 4D7 and 2M12 cells without and with doxycycline (Dox)-induced expression of Eklf shRNA. The cells without or with induction by DMSO for 48 h were treated with doxycycline. The levels of EKLF protein in the whole cell extracts were then analyzed by Western blotting, as exemplified in the upper right panels. Tubulin was used as the loading control. RT-PCR analysis showed that the knockdown of EKLF reduced the levels of total Tal1 mRNA and βmaj mRNA in DMSO-induced cells, as exemplified in the upper left panels and statistically analyzed in the two histobar diagrams below. The gel band signals were all normalized to that of actin. * p < 0.05, and *** p < 0.001 by Student’s t test. Error bars, SD.

