Figure 4.
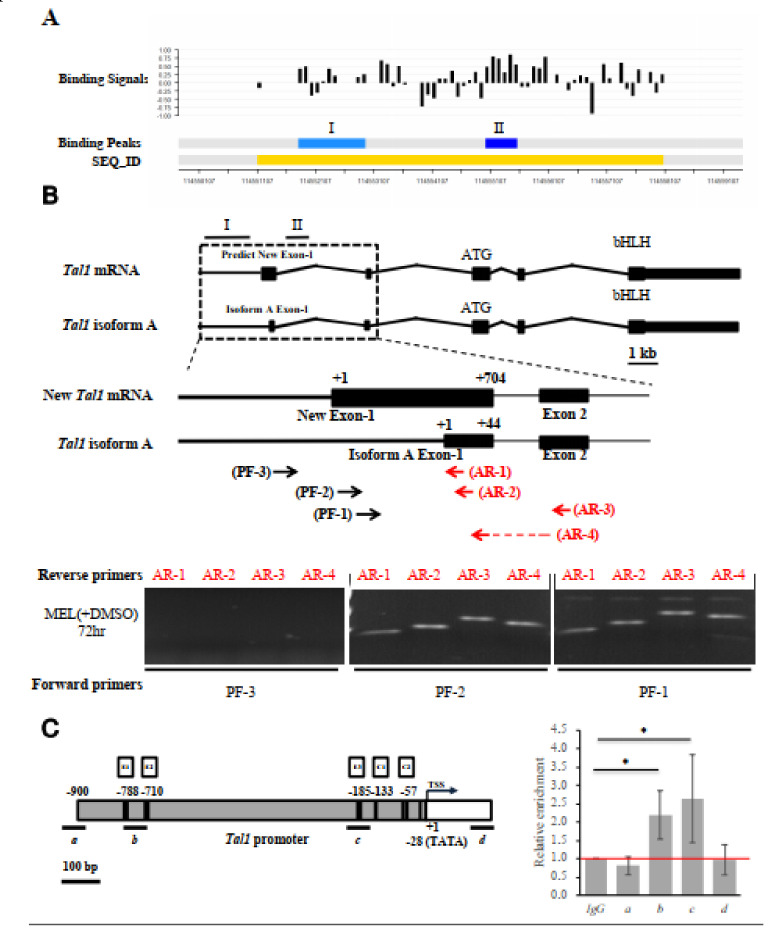
Identification and characterization of the authentic exon-1 and promoter of Tal1 gene. (A) ChIP-chip promoter array data around the Tal1 gene region. The black bars indicate the signals from the individual probes (“binding signals”). The blue regions I and II indicate the EKLF-binding signals from ChIP-chip promoter array analysis of two different mouse E14.5 fetal liver samples (“binding peaks”). The yellow region indicates the sequence ID (SEQ_ID). (B) RT-PCR validation of the newly identified exon 1 of Tal1 mRNA. Top, maps of the newly identified exon structure of Tal1 mRNA in comparison with that of Tal1 isoform A. Exons 1–5 are represented by the black boxes. Middle, maps of the exon-1 of Tal mRNA and Tal1 isoform A, respectively, are shown above the primers used for RT-PCR analysis of the Tal1 mRNA. The sequences of the reverse primers AR-1 and AR-2 are derived from the exon 1 of Tal1 isoform A. AR-3 is derived from the exon 2 sequence. The reverse prime AR-4 is across exons 1 and 2. The sequences of the forward primers PF-1 and PF-2 are from the predicted new exon-1, while PF-3 is from the upstream region. Bottom, gel band patterns of the RT-PCR analysis of DMSO and MEL cell RNAs using different sets of PCR primers. (C) ChIP-qPCR analysis of EKLF-binding to the Tal1 promoter. The map of the Tal1 promoter region is shown on the left, with the CACCC boxes (E1, E2, and E3), CCAAT boxes (C1 and C2), the TATA box, and the transcription start site (TSS, +1) indicated. The four regions (a, b, c, d) are bracketed by the four primer sets used in qPCR analysis of chromatin from DMSO-induced MEL cells immunoprecipitated with anti-EKLF. The relative folds of the enrichment of the chromatin DNA samples pulled down by anti-EKLF are calculated as the Cq values over those derived from use of the IgG and shown in the right histograph. Error bars represent standard deviations from 3~7 biological repeats. The statistical significance of the difference between the experimental and control groups was determined by the two-tailed Student’s t test, * p < 0.05.

