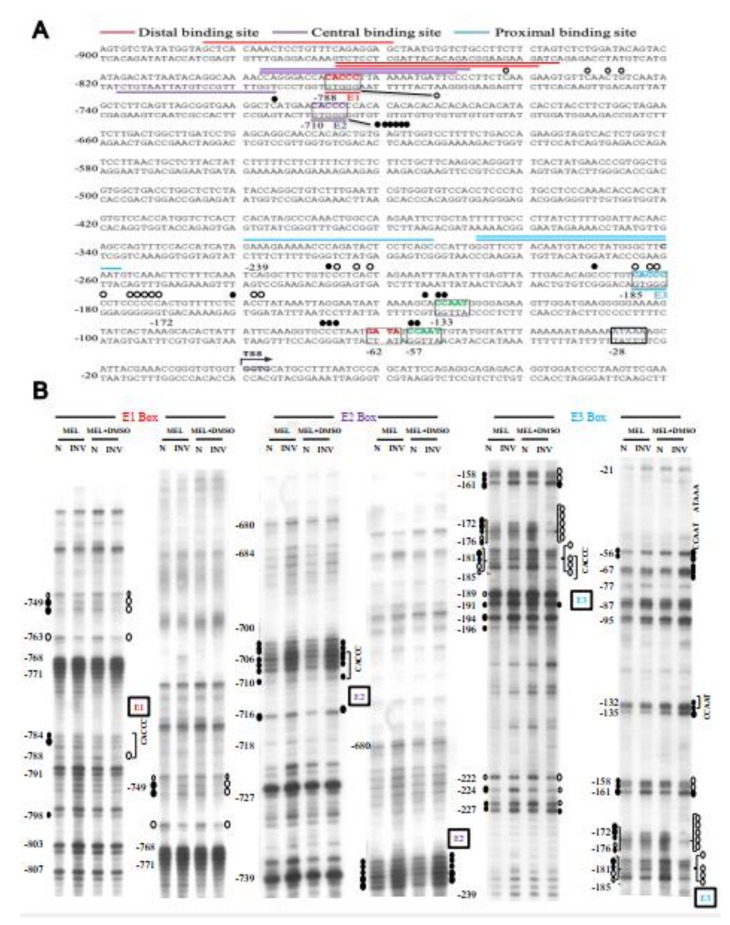
Figure 5.
Genomic footprinting analysis of the promoter of Tal1 gene in MEL cells. (A) The protected bases (○) and hyper-reactive bases (●) of the Tal1 promoter region in MEL cells after DMSO induction, as deduced from the in vivo DMS footprinting analysis, are labeled on the DNA sequence. The footprinting pattern indicates the binding of EKLF on the E3 box. (B) The representative autoradiographs of the analysis of the upper strand of the Tal1 promoter region by in vivo DMS protection and LMPCR assays are shown. Locations of different factor-binding motifs/boxes, i.e., E1, E2, E3, CCAAT, and ATAAA, are indicated on the right of the gel patterns. Numbers on the left correlate with those indicated on the sequence in (A). The patterns in the N and INV lanes are the results from the in vitro and in vivo DMS cleavages, respectively. Only those residues consistently showing differences from the controls are indicated. The sizes of the circles reflect the different extents of the protection or enhancement of DMS cleavage in vivo vs. in vitro.

