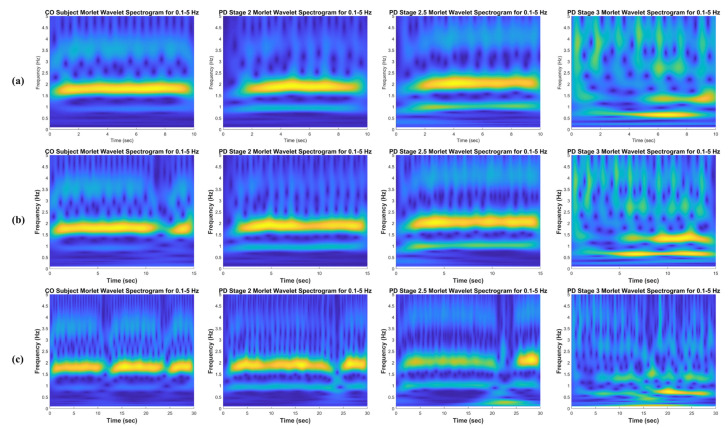
Figure 4.
Time-frequency spectrograms using CWT of the CF vGRF signals of CO, PD Stage 2, PD Stage 2.5, and PD Stage 3 subjects in the 0.1–5 Hz frequency range for (a) a 10 s time window size, (b) a 15 s time window size, and (c) a 30 s time window size from Ga [21] dataset.

