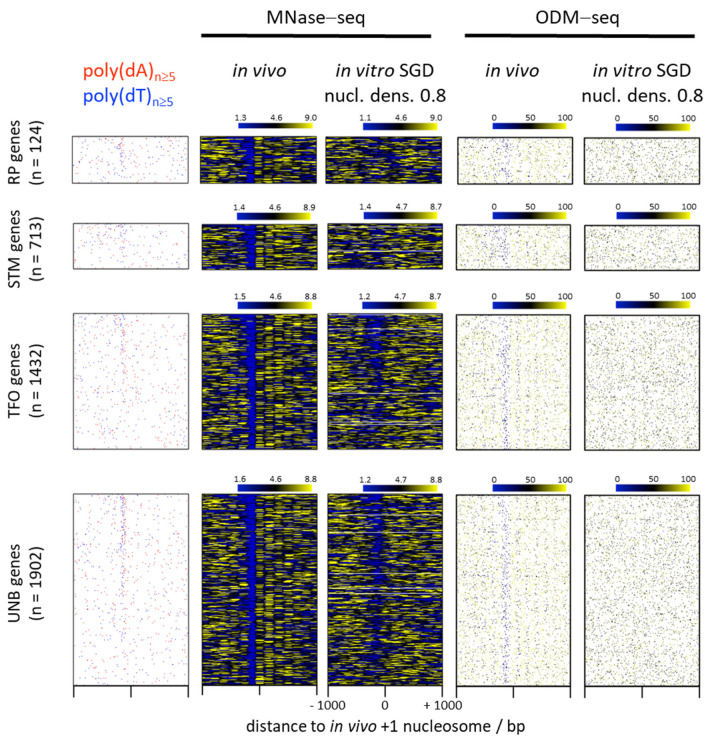
Figure 1.
Correlation of poly(dA)/poly(dT) tract occurrence with low nucleosome occupancy in in vivo chromatin or in in vitro salt gradient dialysis (SGD) reconstituted chromatin monitored by MNase-seq or by DNA methylation footprinting (ODM-seq). Intrinsic nucleosome depletion over poly(dA)/poly(dT) tracts in SGD chromatin relative to the in vivo depletion in S. cerevisiae is less pronounced if monitored by ODM-seq than previously seen by MNase-seq [30,31,32]. From left to right: heatmaps (linked rows) of poly(dA)/poly(dT) tract occurrence on the coding strand, MNase-seq and ODM-seq data, each of in vivo (S. cerevisiae wild type BY4741) chromatin and of genome-wide in vitro salt gradient dialysis (SGD) chromatin reconstituted at a nucleosome density (nucl. dens.) of 0.8 (as defined via histone-to-DNA mass ratio, [33]). Data are subdivided into the groups of RP (ribosomal protein), STM (SAGA/TUP/Mediator regulated), TFO (transcription factor organized, especially by general regulatory factors like Reb1 and Abf1) and UNB (unbound by anything but the preinitiation complex) genes as defined in [34]. Number (n) of genes considered in each group is indicated. MNase-seq nucleosome dyad densities were normalised so that the sum of each row (gene) equals 1 [17,33] and plotted as 147 bp extended dyads. MNase-seq colour scales report normalized dyad densities ×1000 and range from the 10th to 90th percentile values of the individual panel, with extreme values outside these bounds being limited to the minimum/maximum of the scale. ODM-seq heatmaps report absolute nucleosome occupancy values ranging from 0% to 100%. Coordinates with missing values form a white background. All heatmaps are aligned at in vivo +1 nucleosome positions [35] and sorted in descending order from top to bottom by the number of bp within homopolymeric poly(dA) and poly(dT) tracts ≥5 bp long in promoter NFRs (nucleosome free regions between the borders (dyad position+ or −73 bp, respectively) of −1 and +1 nucleosomes [16]). Homopolymeric poly(dA)/poly(dT) tracts of at least 5 bp length were called by determining nucleotide frequency on the sense strand in a 5 bp sliding window with 1 bp step size. Every bp coordinate that is at the center of such a 5 bp homopolymeric poly(dA)/poly(dT) window is coloured in red or blue, respectively, all others in white. Ten percent, 14%, 18% and 14% of RP, STM, TFO and UNB gene promoters, respectively, have no poly(dA) or poly(dT) tracts ≥5 bp long within their NFRs. These genes are sorted in ascending order from top to bottom by genomic coordinate. MNase-seq data are from [33] of in vivo (GSM4175394) and in vitro (GSM4175430) chromatin. ODM-seq data are from [17] of in vivo (GSE141051) and in vitro (GSM4193216) chromatin.

