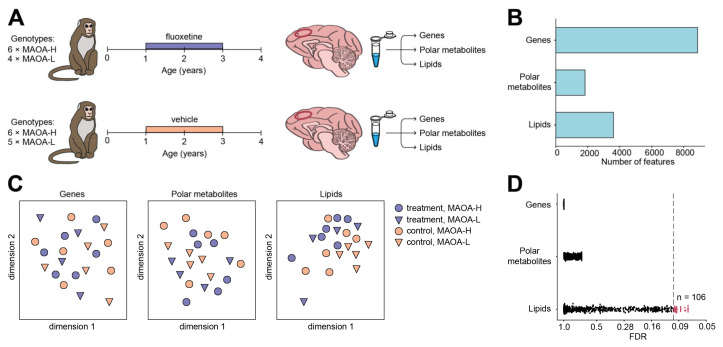
Figure 1.
(A) Schema of experimental design. (B) Number of quantified genes, polar metabolites, and lipids. (C) Multi-dimensional scaling plots visualizing variation among samples calculated based on abundance levels of 8871 genes, 1829 polar metabolites, and 3608 lipids. Colors correspond to treatment status, shapes to the MAOA genotype. (D) Distribution of t-test FDR values calculated for 8871 genes, 1829 polar metabolites, and 3608 lipids in the comparison between treated and control animals. Dashed line corresponds to FDR cutoff of 10%. The number of lipids passing this FDR cutoff (red) is marked on the right. The identified number of lipids passing the cutoff is greater than expected by chance (permutations, p = 0.008).

