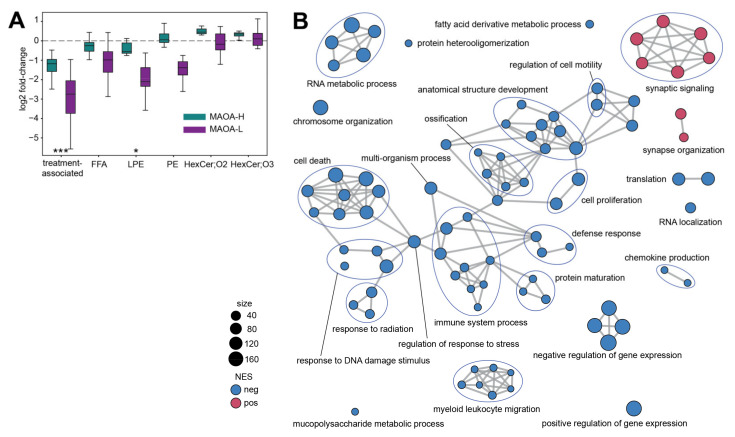
Figure 3.
(A) Base two log-transformed fold-change (log2 FC) values calculated between treated and control animals carrying MAOA-H (green) and MAOA-L (purple) genotype. X-axis labels indicate lipids used in the comparison: 106 treatment-associated lipids and lipids contained in treatment-affected lipid classes: FFA, LPE, PE, HexCer;O2, and HexCer;O3. Boxes show median log2 FC values and interquartile interval. Error bars extend according to Tukey’s original boxplot definition. Asterisks indicate enrichment in lipids showing treatment-by-MAOA genotype interaction (hypergeometric test, *** p < 0.001, * p < 0.05). (B) Gene ontology (GO) terms enriched in gene expression differences between treated and control animals (GSEA, adjusted p < 0.05). One point indicates one GO term. Colors show negative (blue) and positive (red) normalized enrichment score values, which correspond to the dominant direction of expression change between treated and control animals within the GO term. Symbol size is proportional to the number of genes in the GO term. Edges connect functionally related GO terms.

