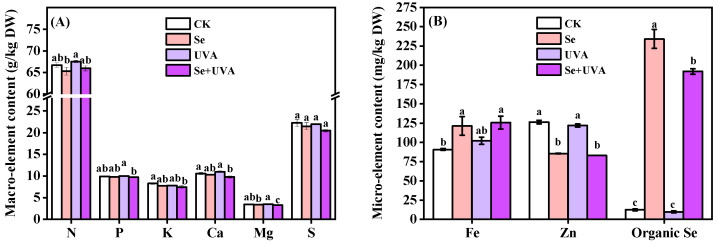
Figure 7.
The contents of macroelement (A) and microelement (B) content in broccoli microgreens under Se (100 μmol/L Na2SeO3), UVA (40 μmol/m2/s), and combined treatments. The vertical bars indicate standard errors, n = 3. Different lower-case letters above the bars indicate significant differences between treatments by Duncan’s multiple range test at a level of 0.05.

