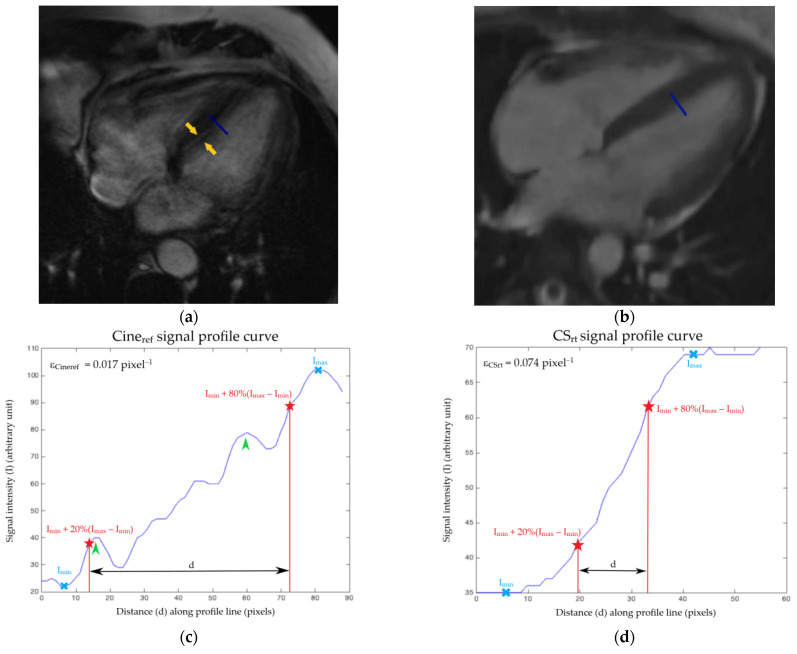
Figure 1.
Example of edge sharpness assessment at end-diastole for a 56-year-old male patient suffering from atrial fibrillation. The same four-chamber view at end-diastole is acquired with (a) the Cineref sequence and (b) the CSrt sequence. An orthogonal profile line was drawn at mid-cavity across the border between the septal myocardium and the left ventricular blood pool (blue line) on a four-chamber view. It provided intensity profiles (blue curves) along the line for (c) Cineref and (d) CSrt cine. The edge sharpness was the inverse of the distance d (in pixels) between the positions corresponding to 20% and 80% (red stars) of the difference between the maximum and minimum signal intensities (blue crosses). The edge sharpness was expressed in pixel−1. This measurement was performed at end-diastole and end-systole for both sequences. Note that the peaks (arrows heads) added to the Cineref signal profile curve (c) correspond to the doubling of the interventricular septum border (arrows) on the cine view (a). The same assessment was performed on both sequences at end-diastole and end-systole for the 71 enrolled patients. Abbreviations: Cineref, reference segmented cine; CSrt, real-time compressed sensing cine; εCineref, edge sharpness measured on Cineref sequence; εCSrt, edge sharpness measured on CSrt cine; I, signal intensity; Imin, minimal signal intensity; Imax, maximal signal intensity; d, distance along the profile line.

