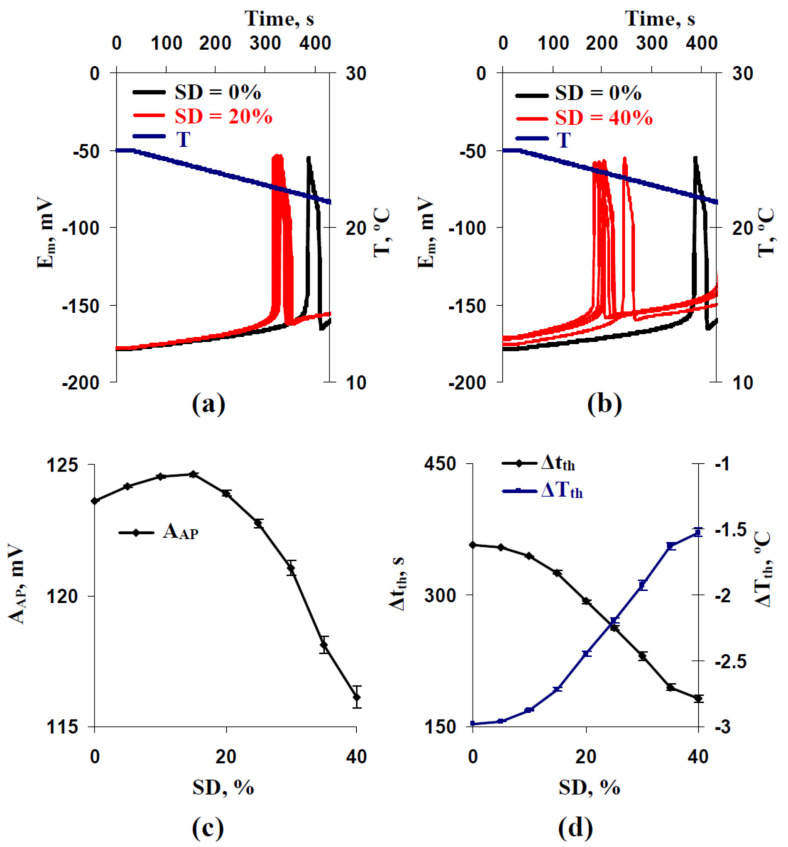
Figure 4.
Examples of simulated changes in the membrane potential (Em) induced by a decrease of temperature (T) with a 0.5 °C min−1 rate at the standard deviation of initial H+-ATP-ase activity in cells (SD) equaling to (a) 20% and (b) 40%. (c) Dependences of the averaged amplitude of the first action potential (AAP) and (d) its time and temperature thresholds (Δtth and ΔTth, respectively) on SD. Parameters of cooling-induced changes in Em at SD = 0% were used as a control. Only five repetitions are shown in (a,b). Averaged parameters (AAP, Δtth, and ΔTth) shown in (c,d) were calculated on the basis of 25 repeated simulations.

