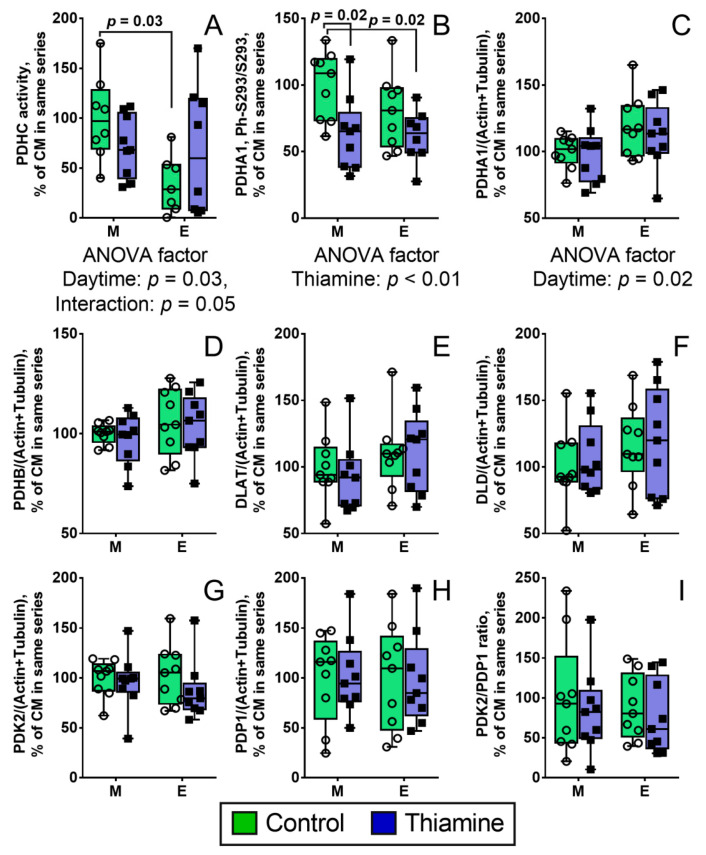
Figure 1.
Daytime- and thiamine-dependent regulation of the PDHC activity (A); PDHA1 Ser293 phosphorylation (B); and protein levels of the catalytic and regulatory components of PDHC (C–I); The protein components are shown as UNIPROT gene names on the Y axes. The data are presented as box-plots with values determined in individual animals and their median. M—morning, E—evening. Each group is comprised of nine animals, n = 9 (B–I); with negative values of the PDHC activity being excluded (especially in Control Evening group, see Methods), n = 7–9 (A). The data are analyzed by two-way ANOVA with Tukey post-hoc test. p-values of significant differences between the four studied groups are indicated on the graphs. In case of significance (p ≤ 0.05), p-values for influence of the analyzed factors (daytime and thiamine) and their interaction are indicated under the graphs.

