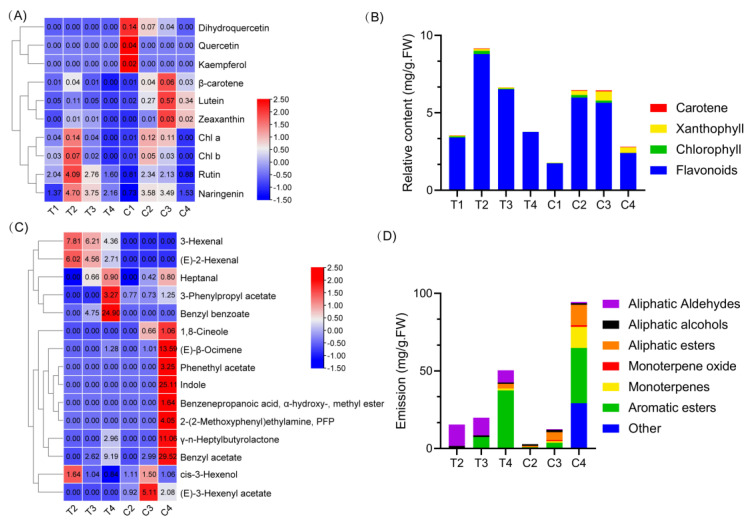
Figure 2.
Comparison of the changing profiles of floral pigment and fragrant component in tepals and coronas. (A). The heatmap shows the amount of pigments in tepals and coronas during flower development. (B). Changing profiles of pigments in tepals and coronas; (C). The heatmap shows volatile organic components (VOCs) amounts in tepals and coronas during flower development; (D). Changing the profiles of volatiles in tepals and coronas. The heatmap was drawn by TBtools software and the function “scale” was used for normalized the data by rows.

