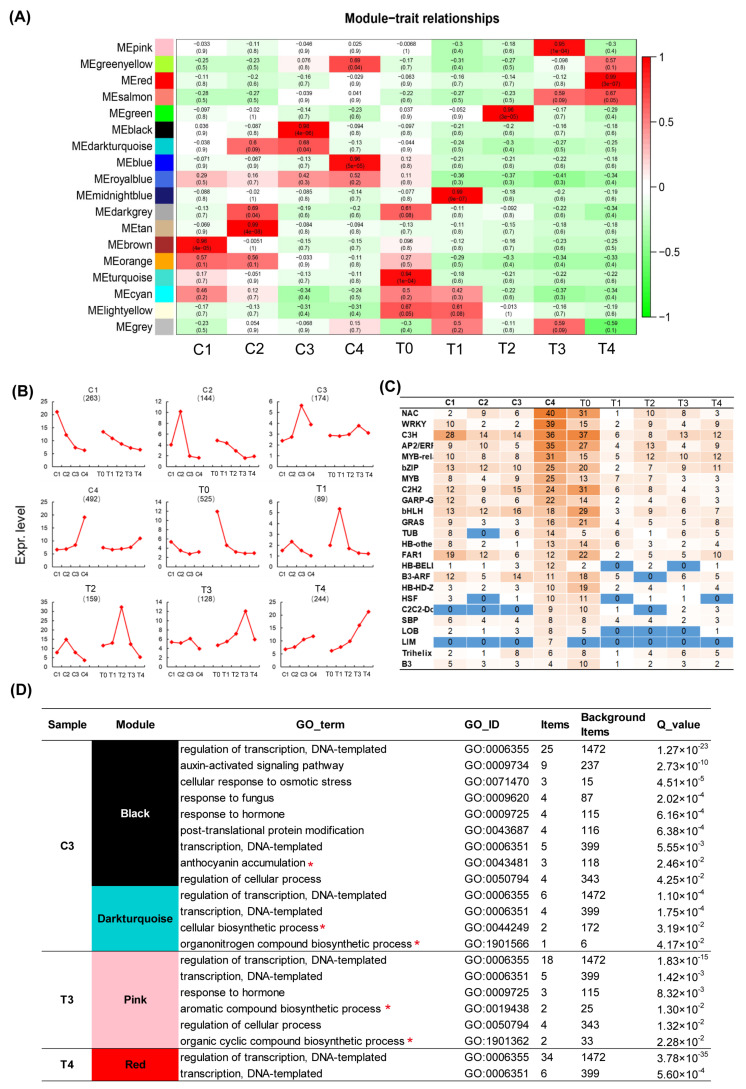
Figure 6.
Analysis of transcription factor genes in the tepal and corona of narcissus. (A). Analysis of WGCNA of 3,193 transcription factor family genes. Module-sample correlations and corresponding p-values (in parenthesis). The left panel shows the sixteen modules. The color scale on the right shows module-trait correlation from −1 (green) to 1 (red). (B). Gene expression patterns within different sample-specific modules. Y axis represents the average expression value of genes in sample-specific modules, and the numbers in parentheses represent the number of genes in sample-specific modules. (C). Distribution of transcription factor families in the tepal and corona during flower development. (D). Functional GO enrichment analysis of the transcription factor specific module of C3, T3 and T4 refered to Figure 6A; red star labeled indicates floral pigment and fragrance metabolism related pathway. Black and darkturquoise modules are the specific modules of C3, pink is T3 sample-specific module and red is T4 sample-specific module.

