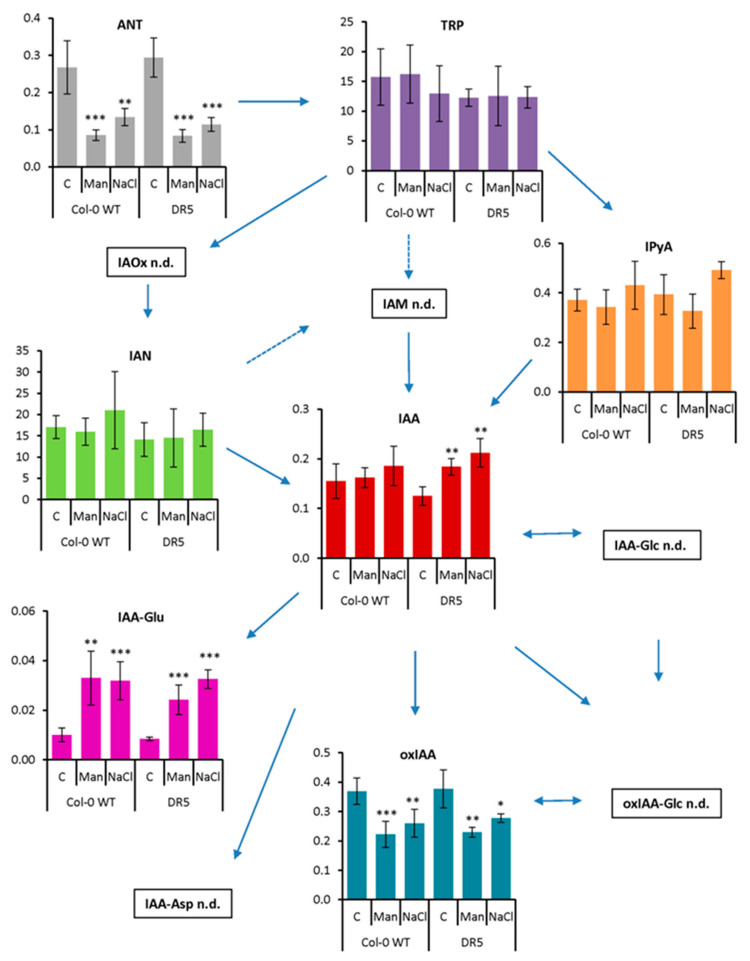
Figure 5.
Auxin metabolome profile measured in the roots of Arabidopsis thaliana Col-0 and DR5rev::GFP line (DR5) after 13-day treatment with 200 mM mannitol (Man) and 100 mM NaCl (NaCl) compared to the corresponding control (C). Metabolite levels are expressed in nmol g−1 FW. Results are average ± SD, n = 3. Asterisks indicate significant difference in the levels under stress conditions versus the control in a Student’s t-test (*, **, and *** correspond to p-values of 0.05 > p > 0.01, 0.01 > p > 0.001, and p < 0.001, respectively). Abbreviations: ANT, anthranilate; IAA, indole-3-acetic acid; IAA-Asp, indole-3-acetyl-L-aspartic acid; IAA-Glc, indole-3-acetyl-1-O-β-d-glucose; IAA-Glu, indole-3-acetyl-L-glutamic acid; IAM, indole-3-acetamide; IAN, indole-3-acetonitrile; IAOx, indole-3-acetaldoxime; IPyA, indole-3-pyruvic acid; oxIAA, 2-oxoindole-3-acetic acid; oxIAA-Glc, 2-oxoindole-3-acetyl-1-O-β-d-glucose; TRP, tryptophan; n.d., not detected.

