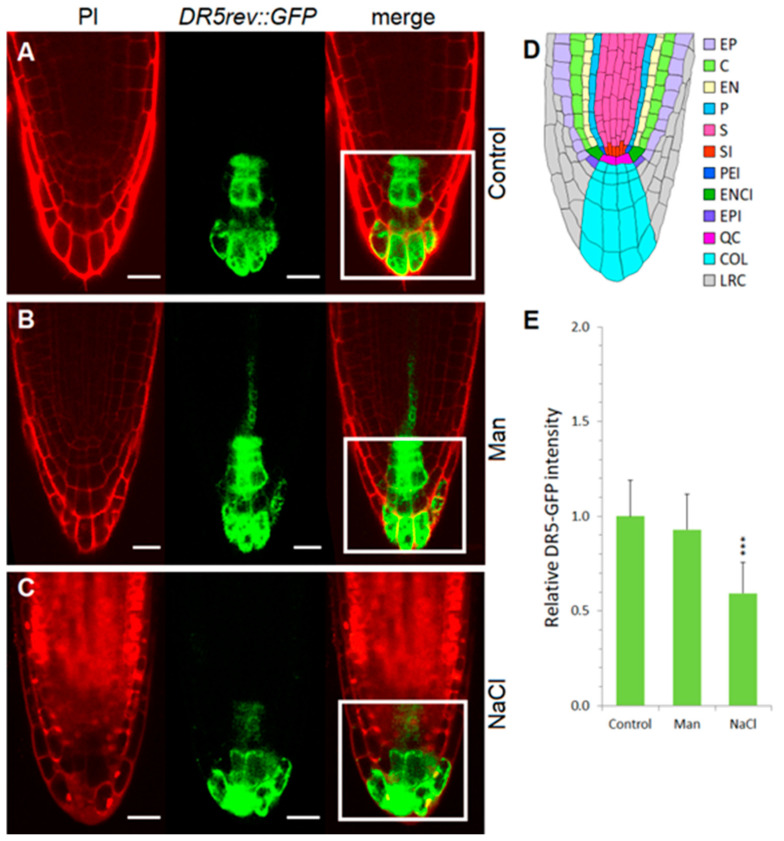
Figure 6.
Auxin distribution and relative GFP intensity in the root tips of DR5rev::GFP line. Seedlings were exposed for 3 h to 2.5 mM MES (control) (A) or control medium was supplemented with 200 mM mannitol (Man) (B) or 100 mM NaCl (NaCl) (C). GFP fluorescence was monitored with the laser scanning confocal microscope and its intensity was quantified. The anatomy of the root tip is shown in (D). The area of interest was selected with the ImageJ rectangle ROI selection tool (white rectangle) in at least 10 roots. Fluorescence intensity (E) of these ROIs was measured as integrated density and the relative intensity, presented in the histogram, was calculated as the value of integrated density normalized to control without stressor; error bars represent SD. Asterisks (***) indicate significant differences with respect to the corresponding control (Student’s t test, p < 0.001). Abbreviations: PI, propidium iodide; E, epidermis; C, cortex; EN, endodermis; P, pericycle; S, stele; SI, stele initials; PEI, pericycle initials; ENCI, endodermis/cortex initials; EPI, epidermis initials; QC, quiescent center; COL, columella; LRC, lateral root cap. Bar: 20 µm.

