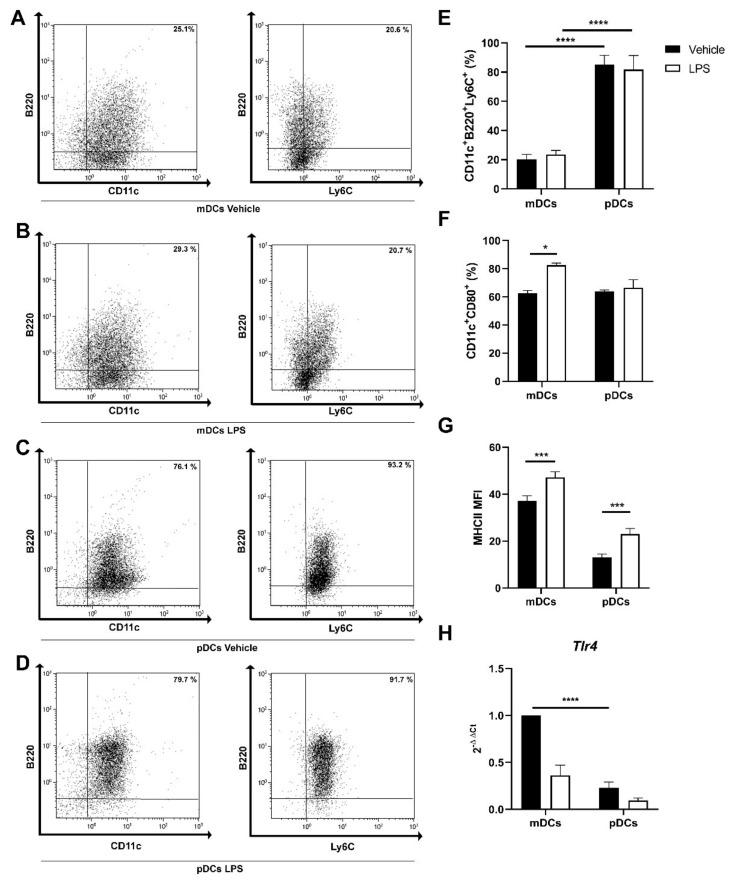
Figure 2.
Representative density plots for CD11c, B220, and Ly6C staining in mDCs (A), myeloid dendritic cells (mDCs) stimulated with lipopolysaccharide (LPS) for 24 h (B), plasmacytoid dendritic cells (pDCs) (C), pDCs stimulated with LPS for 24 h (D). Bar plots for mean ± SEM (n = 4) showing the percentages of CD11c+B220+Ly6C+ cells (E), CD11c+CD80+ cells (F), and major histocompatibility complex II (MHCII) MFI (mean fluorescence intensity) (G) in control and after LPS stimulation for 24 h. Bar plots representing the mean ± SEM (n = 6) of toll-like receptor 4 (Tlr4) gene expression relative to control mDCs (H). * p < 0.05 *** p < 0.001 **** p < 0.0001.

