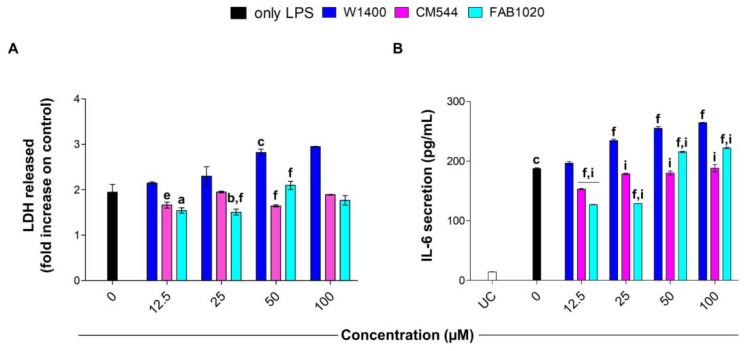
Figure 4.
Cytotoxicity and interleukin-6 secretion in LPS-stimulated human monocytes in the presence of increasing concentrations of 1400 W, CM544 and FAB1020 after 24 h. (A) Bars represent the amount of LDH released in the presence of compounds (0–100 µM) as the fold increase compared to control samples (untreated cells, not shown) is set to 1. a = p < 0.01, b = p < 0.001 and c = p < 0.0001 between LPS-stimulated cells and LPS-stimulated cells treated with compounds. e = p < 0.001 and f = p < 0.0001 between LPS-stimulated cells treated with 1400 W, CM544 or FAB1020 at the same concentration. (B) Bars show the amount of IL-6 released in the same condition of the LDH assay. UC = untreated cells. c = p < 0.0001 between LPS-stimulated cells and untreated cells; f = p < 0.0001 between LPS-stimulated cells and LPS-stimulated cells treated with compounds; i = p < 0.0001 between LPS-stimulated cells treated with 1400 W and LPS-stimulated cells treated with CM544 and FAB1020 at the same concentration.

