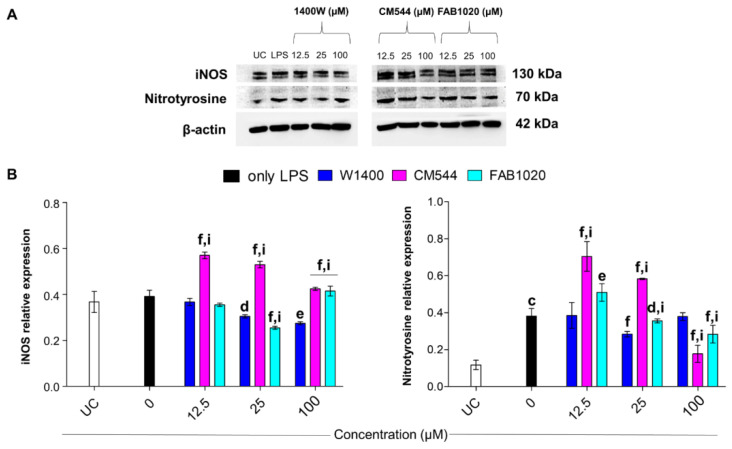
Figure 6.
iNOS and nitrotyrosine protein expression in LPS-stimulated human monocytes in the presence of increasing concentrations of 1400 W, CM544 and FAB1020 after 24 h. (A) Protein bands from a representative experiment. β-actin is used as a loading control. (B) Bar graphs display densitometric values expressed as mean densitometric optical intensities (D.O.I) normalized on those of the loading control. UC = untreated cells. c = p < 0.0001 between LPS-stimulated cells and untreated cells. d = p < 0.01, e = p < 0.001 and f = p < 0.0001 between LPS-stimulated cells and LPS-stimulated cells treated with compounds; i = p < 0.0001 between LPS-stimulated cells treated with 1400 W and LPS-stimulated cells treated with CM544 and FAB1020 at the same concentration.

