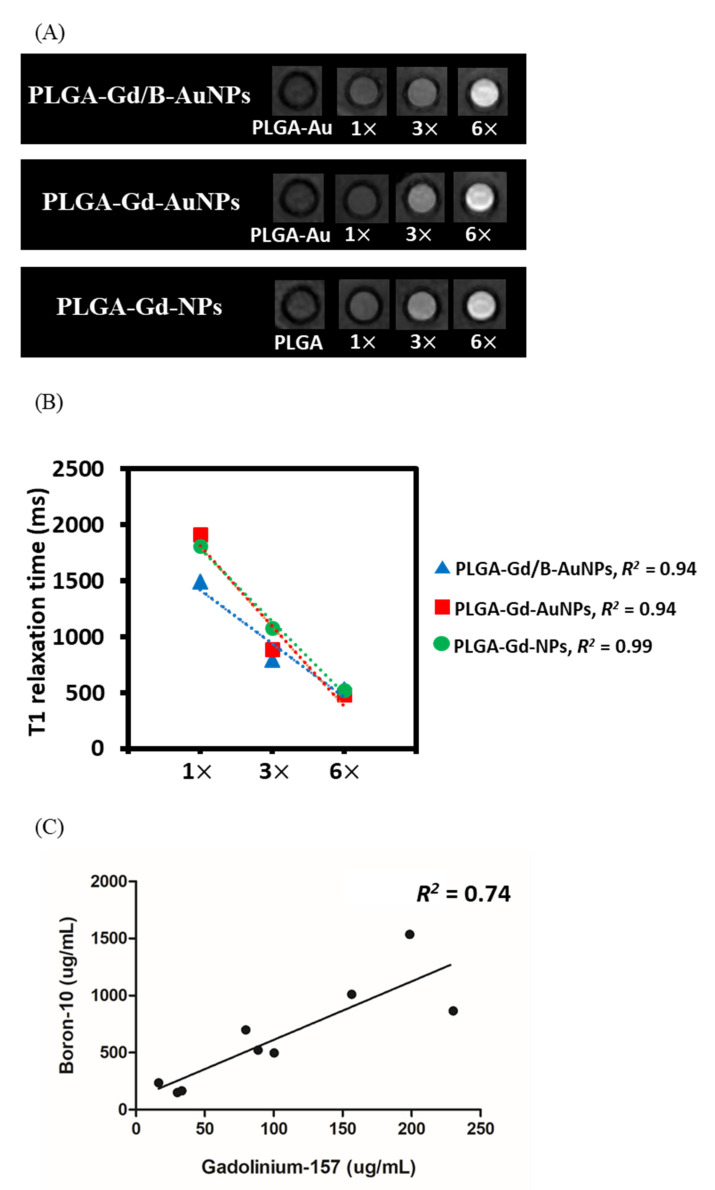
Figure 3.
(A) T1-weighted MR images of nanoparticles at different Gd concentrations. (B) T1 relaxation time as a function of Gd concentration for different nanoparticles. (C) Correlation between B and Gd concentration obtained from inductively coupled plasma mass spectrometry. 1×: 26.6 µg/mL, 3×: 89.5 µg/mL, 6×: 195 µg/mL (gadolinium concentration).

