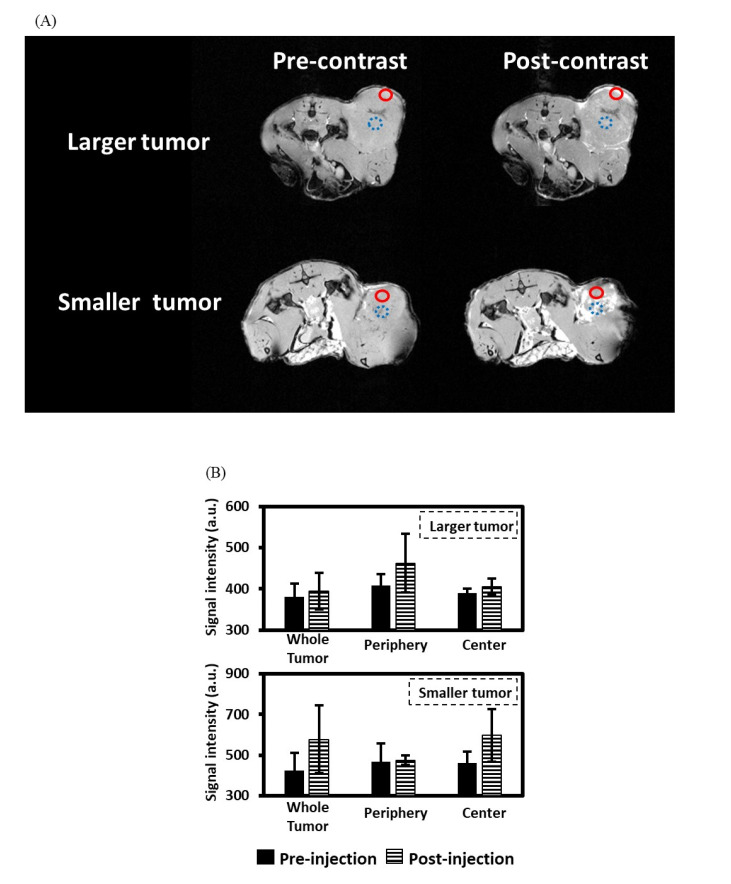
Figure 4.
MR images from representative rats with either 250 ± 50 mm3 (larger) or 100 ± 50 mm3 (smaller) xenograft tumors. (A) MR images before and after 1 h PLGA-BC/Gd-AuNP injection. The red circles with a solid line indicate the location of the tumor periphery while the blue circles with a dashed line indicate the location of the tumor center. (B) Comparisons of signal intensities before and after 1 h PLGA-BC/Gd-AuNP injection.

