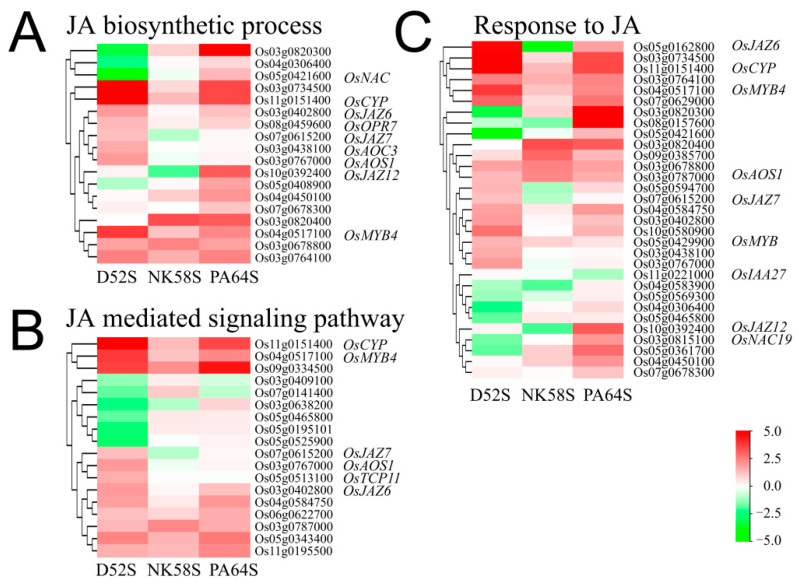
Figure 3.
Heatmap analysis of gene expressions in JA biosynthetic process (A), JA signaling pathway (B) and response to JA (C) in 4th-stage-florets of PA64S, D52S and NK58S. Data are normalized and transformed by log2FC of gene expression in fertile plants, compared to those in sterile plants (n = 3). FC, fold change; S/F, sterile/fertile plants.

