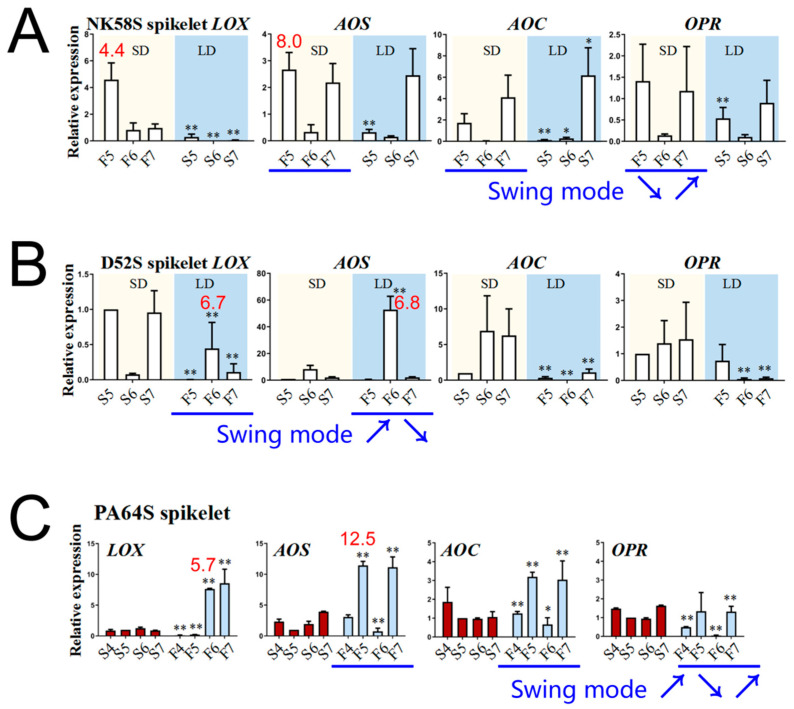
Figure 4.
Expression analysis of JA synthesis enzyme genes in fertility-induced plants under different photoperiod and temperature conditions. The qPCR analysis of LOX, AOS, AOC and OPR genes in spikelets of NK58S (A), D52S (B) and PA64S (C) sterile/fertile lines from the 4th to 7th stages. The internal reference gene is OsActin. PA64S treated by HT/LT are columnar with the red and blue color, respectively. NK58S and D52S treated by LD/SD photoperiod are marked with a blue and yellow background, respectively. Data are shown as mean ± standard deviation (n = 3). Asterisks indicate significant differences between sterile and fertile plants of the same period revealed by Student’s t-test (*, p < 0.05; **, p < 0.01). The significant FC of gene expression in fertile plants compared to those in sterile plants are listed above the columnars in red. The blue arrows represent the trend and direction of gene expression change in fertile plants. LD, long-day cycle; SD, short-day cycle; HT, high temperature; LT, low temperature; S/F, sterile/fertile plants; 4/5/6/7, 4th/5th/6th/7th-stage.

