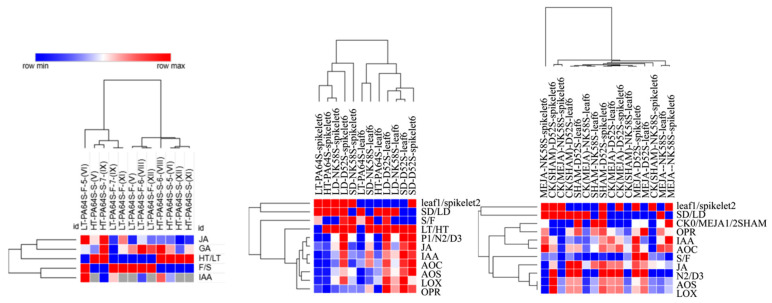
Figure 8.
Heatmap analysis of hormone contents and JA synthesis enzyme activities in D52S, NK58S and PA64S. Data are from Figure 1, Figure 2 and Figure 5, and are treated for homogenization with maximum and minimum values of each indicator marked in red to blue. LD, long-day cycle; SD, short-day cycle; HT, high temperature; LT, low temperature; MEJA, methyl jasmonate; SHAM, salicylhydroxamic acid; CK, control; S/F/R, sterile/fertile/fertility-reverse plants; 5/6/7, 5th/6th/7th-stage.

