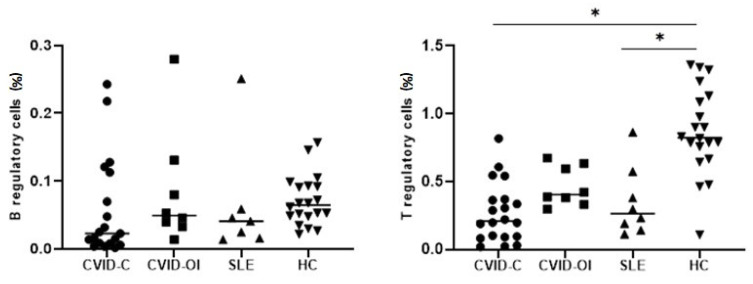
Figure 2.
Differences in the median percentages of T regulatory cells (Tregs) and B regulatory cells (Bregs) between the CVID with complicated phenotype (CVID-C) group, CVID phenotype limited to only infections (CVID-OI group), patients with systemic lupus erythematosus (SLE), and healthy controls (HCs). Data are expressed as median (Q1–Q3) * p < 0.05.

