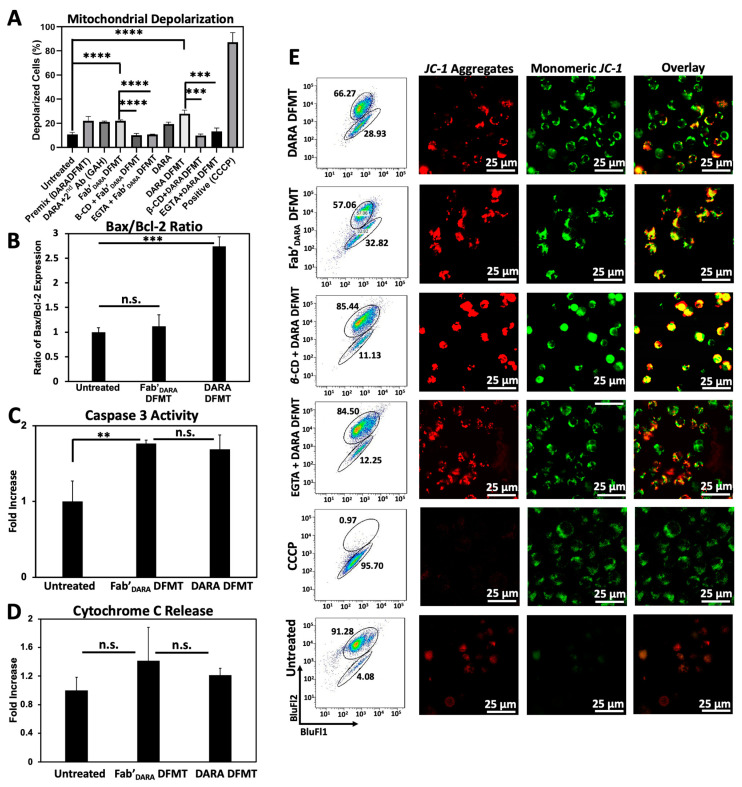
Figure 4.
Investigation of mitochondrial pathway involvement in apoptosis induction in Daudi cells. (A) Compiled mitochondrial membrane depolarization of DARA DFMT and Fab’DARA DFMT treated Daudi cells with or without the presence of inhibitors (EGTA or β-CD). Controls include untreated cells, a DARA-based DFMT “Premix” group, DARA crosslinked with a secondary antibody (goat antihuman: GAH), and a positive control treatment with CCCP. Depolarization was measured by JC-1 red/green fluorescence by flow cytometry. (B) Bax/Bcl-2 expression ratio of DARA-based DFMT and Fab’DARA-based DFMT treated Daudi cells. Expression was measured using immunostaining and flow cytometry. (C) Caspase 3 activity of DARA DFMT and Fab’DARA DFMT treated Daudi cells was measured using PhiPhiLux® assay kit and flow cytometry. (D) Cytochrome C release of DARA and Fab’DARA DFMT on Daudi cells. Increase in Cytochrome C release shown as fold increase over untreated cells. Determined by ELISA. (E) Confocal fluorescence microscopy visualization of mitochondrial depolarization of DARA DFMT with or without the presence of EGTA or β-CD. More red fluorescence indicates healthier mitochondria while more green fluorescence indicates the occurrence of depolarization. **** p < 0.0001, *** p < 0.001, ** p < 0.01, n.s. nonsignificant, by One-Way ANOVA and Tukey test.

