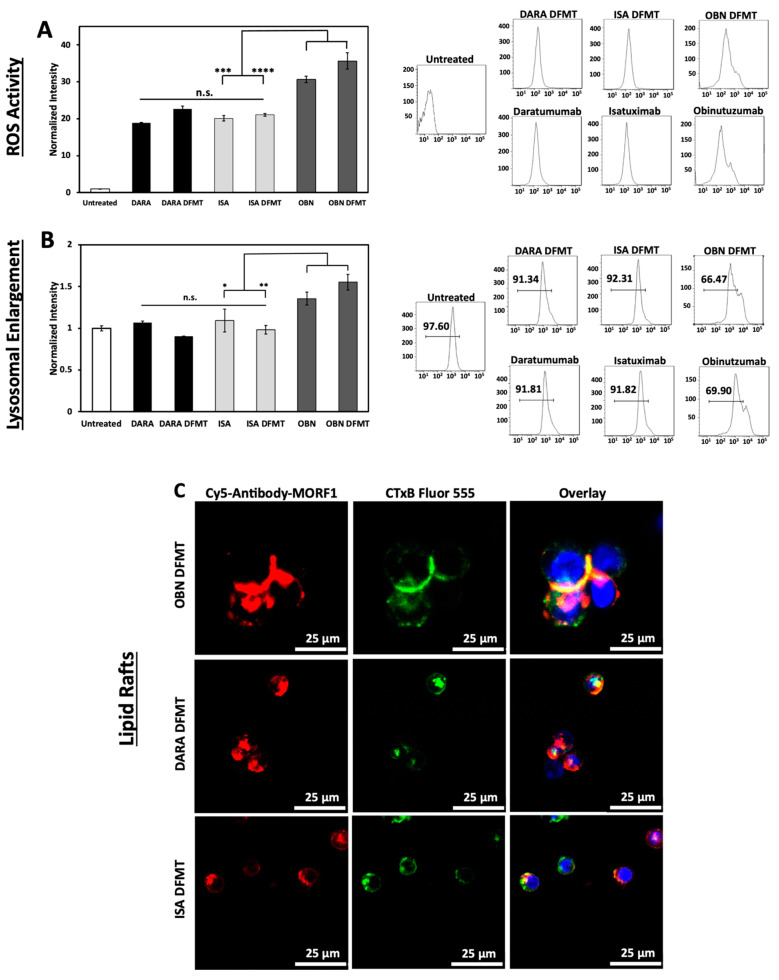
Figure 5.
(A) Generation of ROS in DARA-, ISA-, and OBN-based DFMT treated Raji cells. The ROS production was measured by oxidation of 2′,7′-dichlorodihydrofluorescein diacetate (H2DCFDA) and quantified with flow cytometry. (B) Lysosomal enlargement of DARA-, ISA-, and OBN-based DFMT was quantified by LysoTracker Green DND-26 and flow cytometry. (C) Confocal microscopy was employed to observe any redistribution of CD38 receptors into cholesterol-rich lipid rafts. Ab-MORF1 (red); lipid raft marker: cholera toxin subunit B (CTxB) Alexa Fluor 555 (green). Nuclei were stained with Hoechst (blue). **** p < 0.0001, *** p < 0.001, ** p < 0.01, * p < 0.05, n.s. nonsignificant by One-Way ANOVA and Tukey test.

