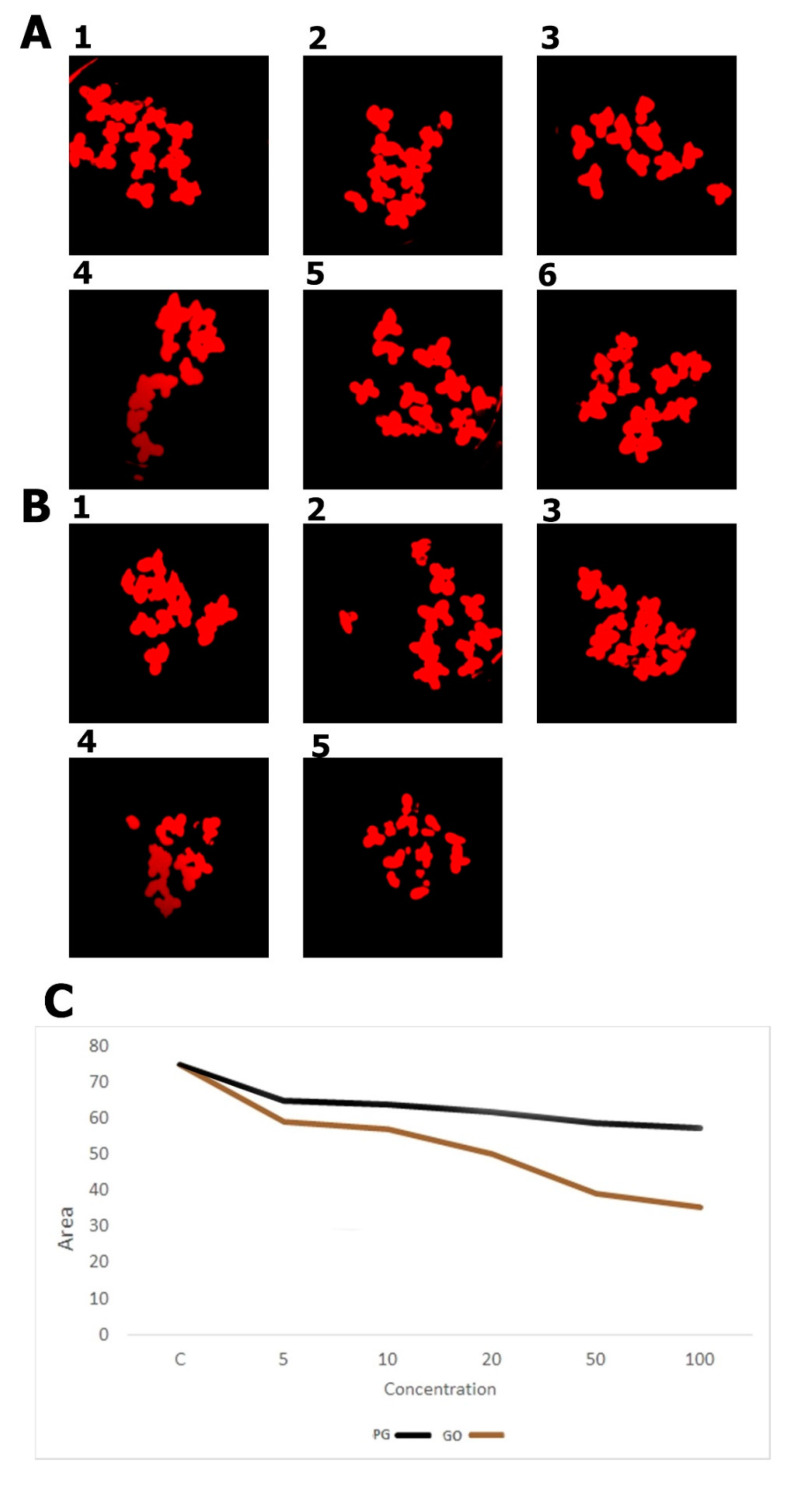
Figure 8.
The area of fronds determined from the images after autofluorescence analysis. (A1) Control group; (A2) PG 5 μg/mL; (A3) PG 10 μg/mL; (A4) PG 20 μg/mL; (A5) PG 50 μg/mL; (A6) PG 100 μg/mL; (B1) GO 5 μg/mL; (B2) GO 10 μg/mL; (B3) GO 20 μg/mL; (B4) GO 50 μg/mL; (B5) GO 100 μg/mL; (C) calculated area of the fronds.

