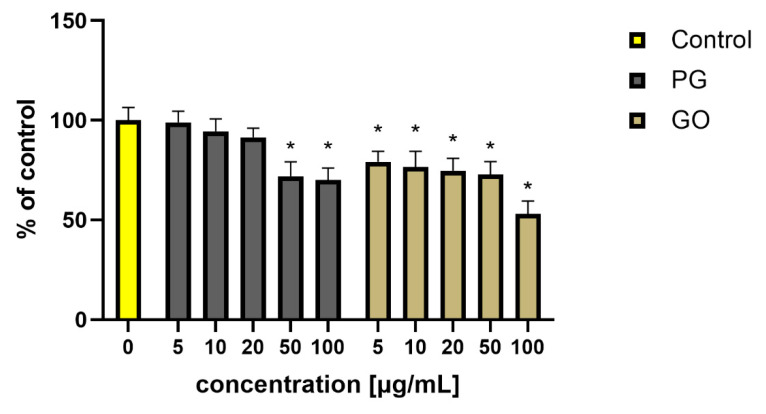
Figure 9.
Viability of S. aureus (percent of the control) after PG and GO treatment. Values in the rows marked with an asterisk show statistically significant differences (p < 0.05) as compared to the control assay. Abbreviations: C—control group (untreated cells); PG—pristine graphene; GO—graphene oxide.

