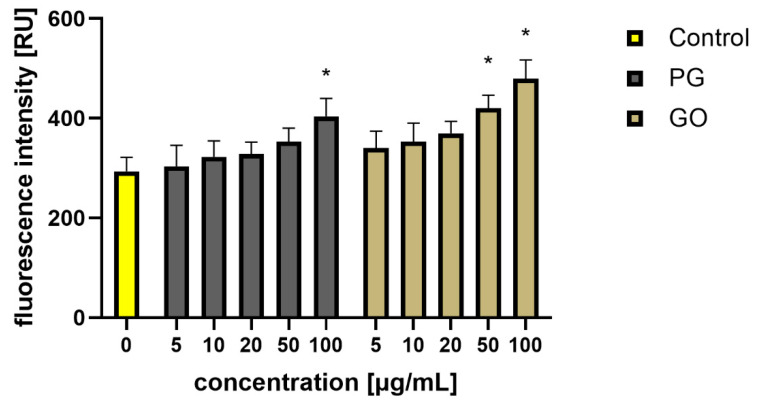
Figure 11.
Analysis of the production of ROS in S. aureus cells after treatment with PG and GO. Values in the rows marked with an asterisk show statistically significant differences (p < 0.05) as compared to the control assay. Abbreviations: C—control group (untreated cells); PG—pristine graphene; GO—graphene oxide.

