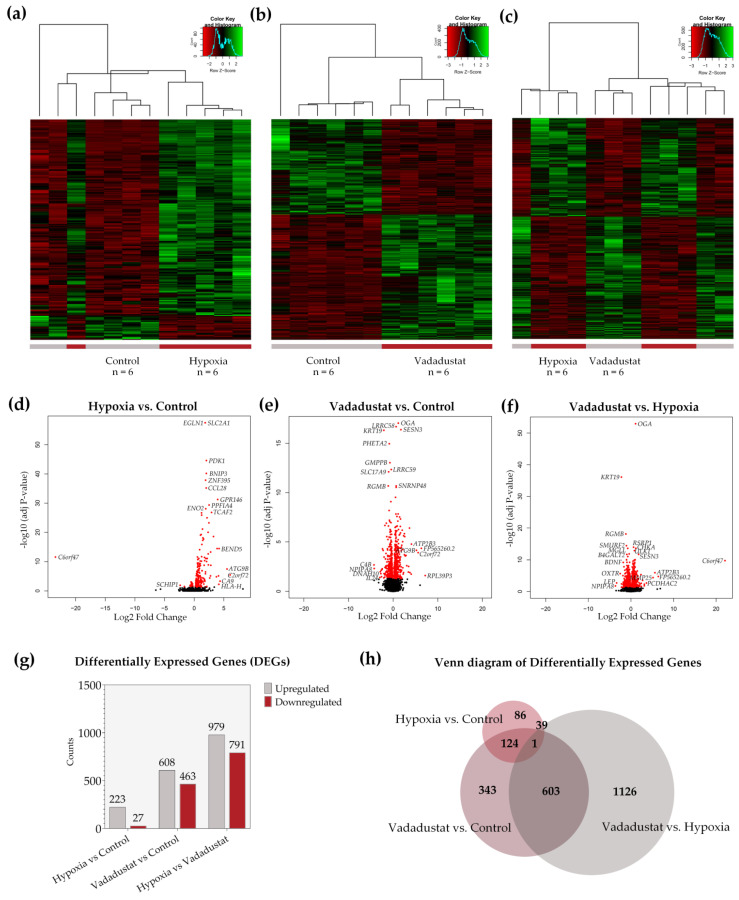
Figure 4.
Analysis of differentially expressed genes (DEGs) in MSCs preconditioned with two hypoxic methods. Lists of DEGs were obtained by comparing the gene expression profile of six populations of hBM-MSCs preconditioned for 6 h in 2% O2 (hypoxia), preconditioned for 6 h with 40 μM Vadadustat, or cultured under 20% O2 (control). Hierarchical clustering heat map showing the correlation between DEGs (p < 0.05) for all pairwise combinations of samples in the dataset along with a hierarchical tree indicating the similarity between samples based on normalized gene expression values obtained from the comparison: (a) hypoxia vs. control (b) Vadadustat vs. control (c) Vadadustat vs. hypoxia. Volcano plot showing statistical significance of differential gene expression data (adjusted p-value) versus magnitude of expression change (log2 Fold Change) from comparison: (d) hypoxia vs. control, (e) Vadadustat vs. control, (f) Vadadustat vs. hypoxia; with significantly DEGs highlighted in red and the names of the most regulated genes highlighted next to the dots (g) The number of up- and downregulated DEGs obtained from all three comparisons (h) Venn diagram illustrating the number of unique and shared DEGs for each comparison.

