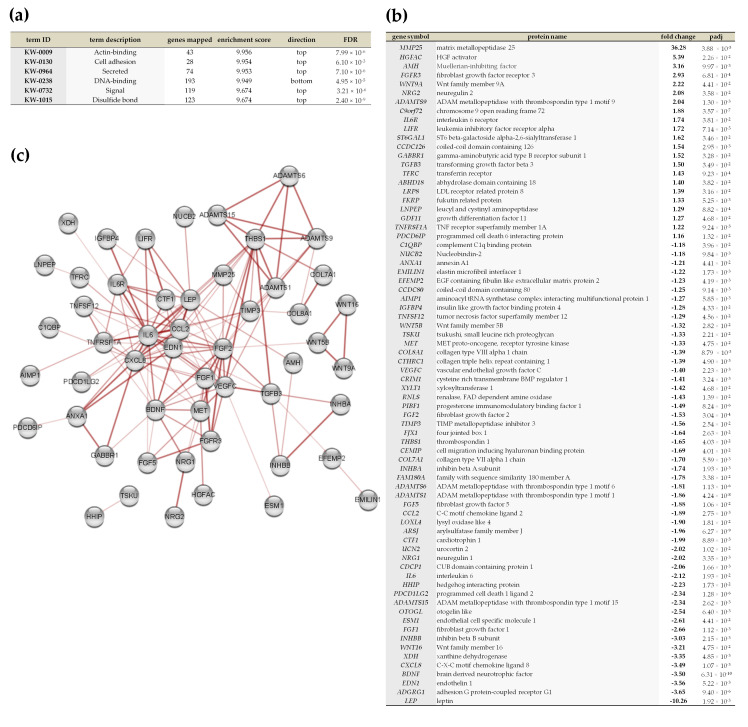
Figure 10.
Analysis of differential expression of genes encoding secretory proteins between MSCs preconditioned with Vadadustat and 2% O2 hypoxia. (a) Results of annotated keywords (by UniProt) obtained using functional enrichment analysis in STRING 11.0 (FDR < 0.05), indicating enriched categories, number of genes mapped, enrichment score, gene location on input, and FDR value for enriched term. (b) Detailed list of 74 genes classified by Annotated keywords analysis into term “secreted” along with the names of the proteins they encode, fold changes in expression (bold), and the adjusted p-values. (c) Map of interactions between proteins encoded by genes classified to the term “secreted” in the annotated keywords analysis, created using protein-protein interaction analysis in STRING 11.0 (full network, score set to medium confidence and FDR < 0.05) visualized using Cytoscape software. Nodes represents proteins, while edges represents protein-protein association. The four edge thicknesses correspond to the confidence level from the thinnest at (0.15), through medium (0.4), high (0.7) to the thickest representing the highest (0.9) confidence, and its presence indicates i.e., that the proteins jointly participate in the shared function.

