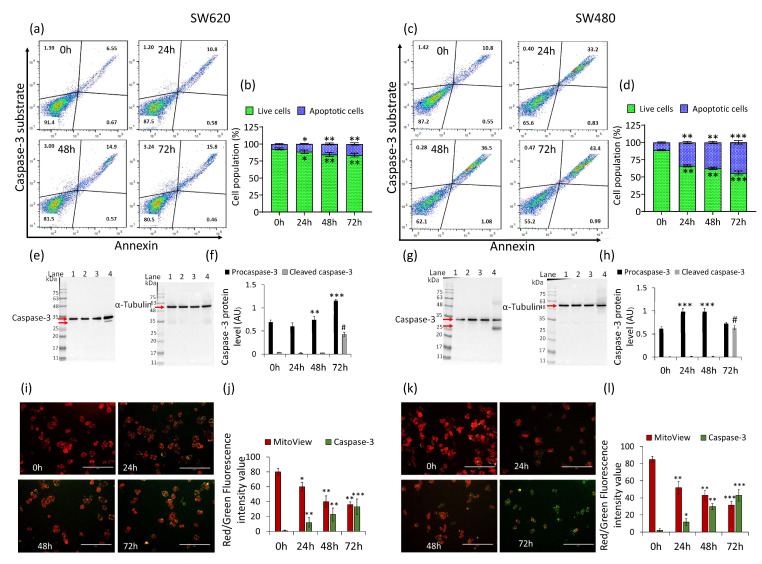
Figure 3.
Effects of δVB on caspase-3 activation. Representative dot plots and analyses of caspase-3 activation by reporting annexin CF 594 and caspase-3 substrate on (a,b) SW620 and (c,d) SW480 cells treated with δVB (1.5 mM) at 24, 48 and 72 h. Cell population was assessed by flow cytometry and results expressed as % of live or apoptotic population with mean ± SD of n = 3 experiments. At least 10,000 events were acquired. Representative full-length blots of Western blotting analysis of caspase-3 in (e,f) SW620 and (g,h) SW480 cells. Lane 1 = 0 h; lane 2 = 24 h; lane 3 = 48 h; lane 4 = 72 h. Before lane 1, molecular weight markers (G266, Applied Biological Materials Inc., Richmond, BC, Canada). Protein expression was calculated, after normalization with α-tubulin as internal control, with ImageJ software and results expressed as arbitrary units (AU). Representative images and analysis of Nucview 488 and Mitoview 633 staining of (i,j) SW620 and (k,l) SW480 cells analyzed by fluorescence microscopy. Results expressed as red and green fluorescence intensity value. Scale bar: 100 μm. * p < 0.05 vs. Ctr; ** p < 0.01 vs. Ctr; *** p < 0.001 vs. Ctr; # p< 0.0001 vs. Ctr.

