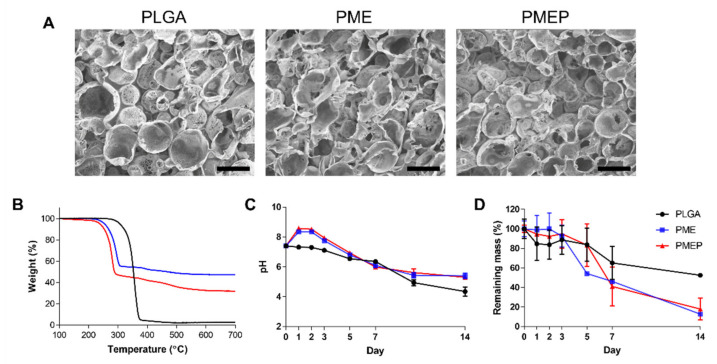
Figure 1.
Scaffold characterization. (A) representative scanning electron microscopy (SEM) images of PLGA, PLGA/MH/ECM (PME), and PLGA/MH/ECM/PDRN (PMEP) scaffold. (Scale bars = 200 µm). (B) thermal gravimetric analysis (TGA) thermograms of each scaffold. Change of (C) pH and (D) mass during in vitro degradation in PBS solution with protease K at 37 °C for 14 days.

