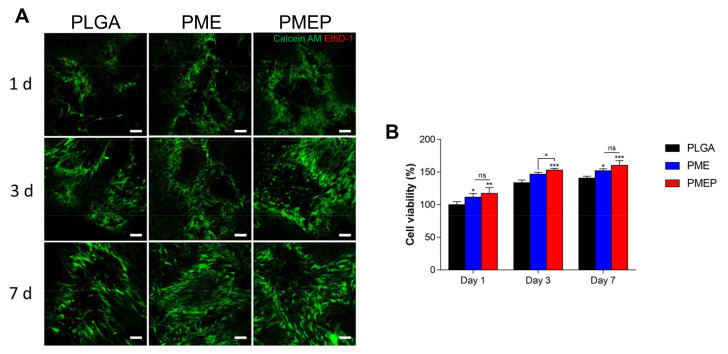
Figure 2.
Biocompatibility of the scaffolds. (A) live-dead assay images on each scaffold at 1, 3, and 7 days (scale bar = 100 μm). (B) cell viability of the hBMSCs onto each scaffold at 1, 3, and 7 days in vitro. The differences were considered significant when ns = not significant (p ≥ 0.05), * p < 0.05, ** p < 0.01, and *** p < 0.001 (n ≥ 3).

