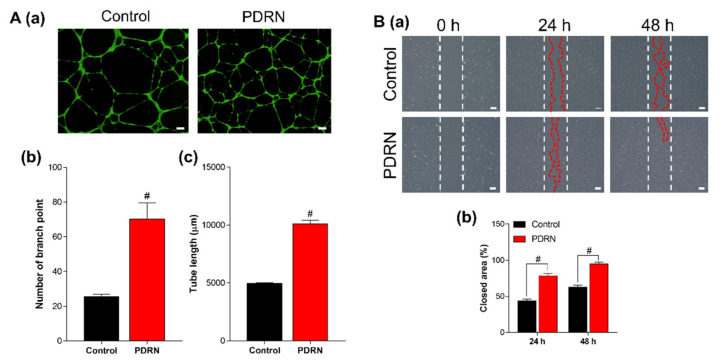
Figure 3.
Biological effects of PDRN. (A) tubule-forming assay; images of HUVECs stained with calcein AM (scale bar = 200 μm) (a) and quantification of branch point (b) and tube length (c). (B) wound healing assay; optical images (scale bar = 200 μm) (a) and quantification of closed area at 24 and 48 h (b). The differences were considered significant when # p < 0.0001 (n ≥ 3).

