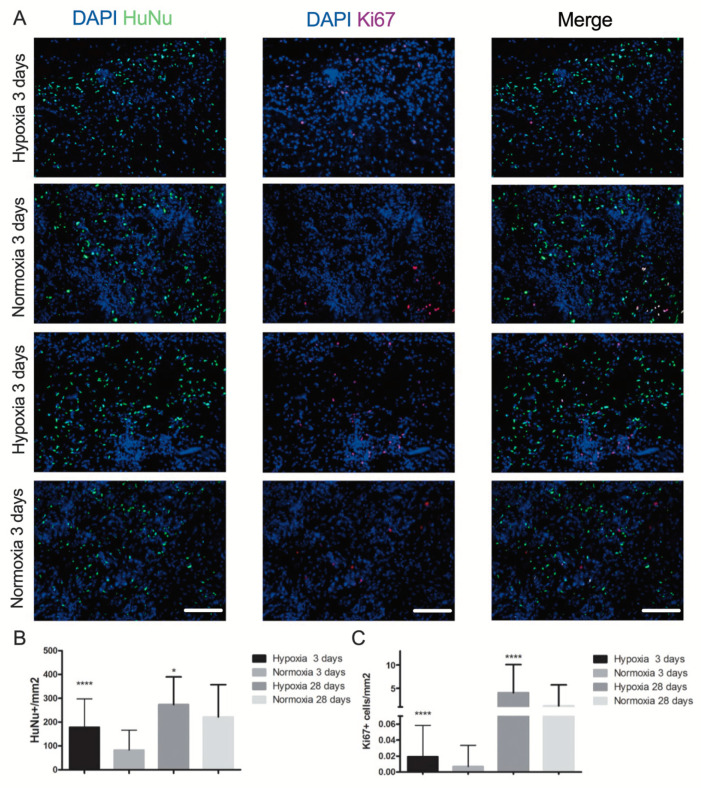
Figure 6.
In vivo human cell engraftment and proliferation. (A) Representative images of implanted construct cultured in hypoxia or normoxia culture. Immunofluorescence staining for specific human nuclei antibody HuNu (green) and for the proliferation marker Ki67 (red) at time points 3 and 28 days (d). Cell nuclei were stained by DAPI (blue). Scale bar = 40 µm. (B) Quantification of total number of implanted human cells (double positive for HuNu and DAPI) and (C) proliferation cells (triple positive for HuNu, Ki67 and DAPI) following 3 and 28 days in vivo implantation. * p < 0.01, **** p < 0.00001. Number of donors: 3 (at least duplicate biological samples per donor). Comparison was performed with one-way ANOVA.

