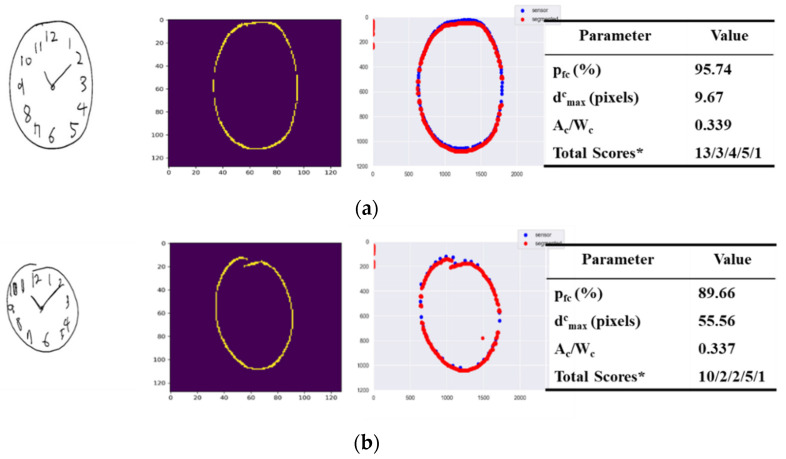
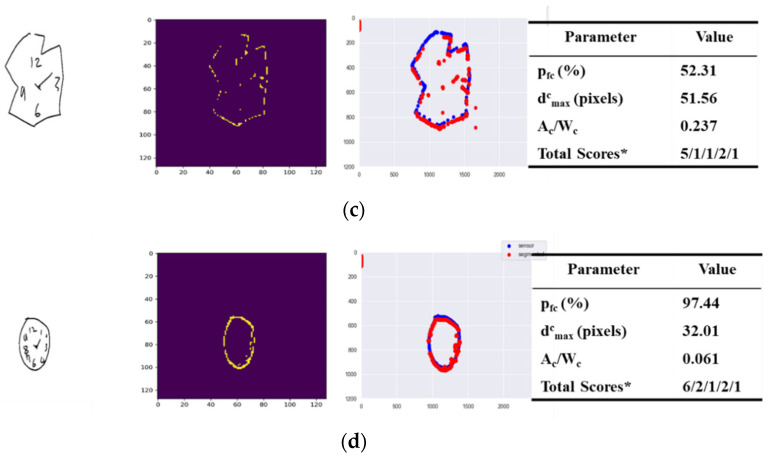
Figure 7.
Four cases of original drawings (left) along with their segmented images (middle) produced by the pre-trained model, DeepC, and their corresponding velocity graphs (right). Four representative examples demonstrating how contours in original images are detected and classified in their types and sizes, showing the original image (first column) with the segmented image (second column), the overlapping image (third column) and the corresponding parameter values (fourth column) of each examples; (a) the case in which the original image is of a closed circular contour sized appropriately; (b) the case in which the original image is of a circular contour sized appropriately, but not wholly closed; (c) the case in which the original image is of an appropriately sized but neither closed nor circular contour; and (d) the case in which the original image is of a closed circular contour but sized not appropriately. * Total score/score of contour/score of numbers/score of hands/score of center.


