Fig. 4.
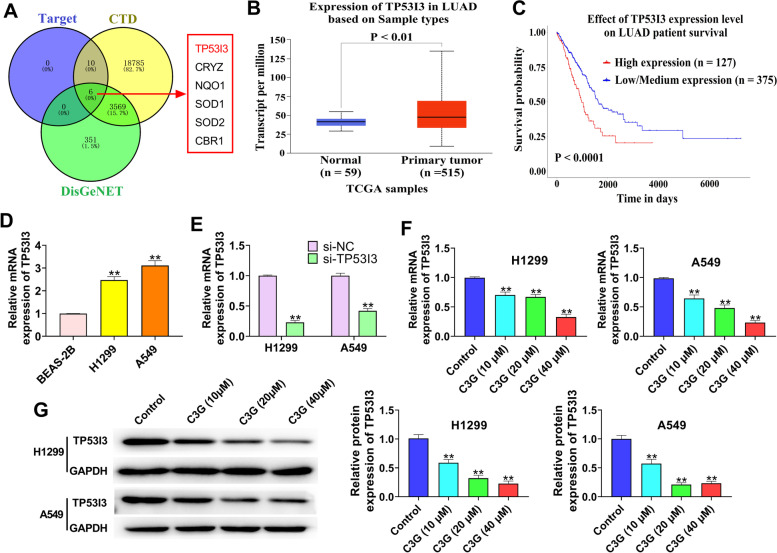
C3G suppressed the expression of TP53I3 in H1299 and A549 cells. A The database of BATMAN, CTD, and DisGeNET showed that C3G was closely associated with six genes (TP53I3, CRYZ, NQO1, SOD1, SOD2, and CBR1). B The expression of TP53I3 in LUAD tissues from TGCA. C Kaplan–Meier curve of the LUAD clinical outcome for TP53I3 from TCGA. D The expression of TP53I3 was detected by qRT-PCR in BEAS-2B, H1299, and A549 cells. E After transfection of si-TP53I3, the expression of TP53I3 in H1299 and A549 cells was detected by qRT-PCR. F After the treatment of C3G (10, 20, and 40 μM), the expression of TP53I3 in H1299 and A549 cells was detected by qRT-PCR. G After the treatment of C3G (10, 20, and 40 μM), the expression of TP53I3 in H1299 and A549 cells was measured by western blot. **P < 0.01, vs. BEAS-2B cells group (D); **P < 0.01, vs. si-NC group (E); **P < 0.01, vs. Control group (F and G)

