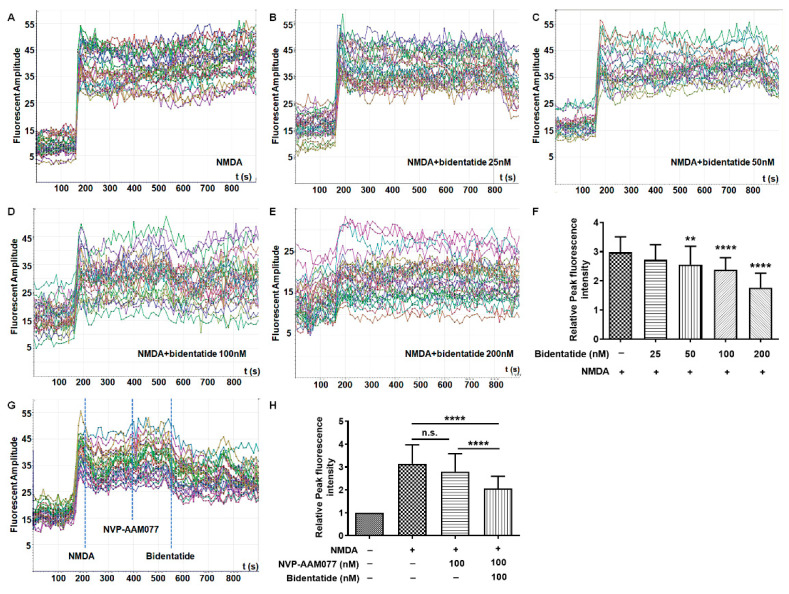
Figure 2.
Bidentatide effects on NMDA-induced Ca2+ overload in cultured hippocampal neurons: (A–E) dynamic changes of intracellular Ca2+ levels in primary cultured hippocampal neurons upon pretreatment with different concentrations of bidentatide and exposure to NMDA (100 μM); (F) bar graph showing the relative fluorescence intensity of NMDA-induced Ca2+ in primary cultured hippocampal neurons; **** p < 0.0001 and ** p< 0.01 versus exposure to NMDA alone; (G) dynamic changes of intracellular Ca2+ levels after the addition of 100 μM NMDA, 100 nM NVP-AMM077, and 100 nM bidentatide; the dotted blue line represents the peak of fluorescence intensity; (H) bar graph showing the relative fluorescence intensity of NMDA-induced Ca2+ in primary cultured hippocampal neurons; **** p< 0.0001; n.s. (no significance).

