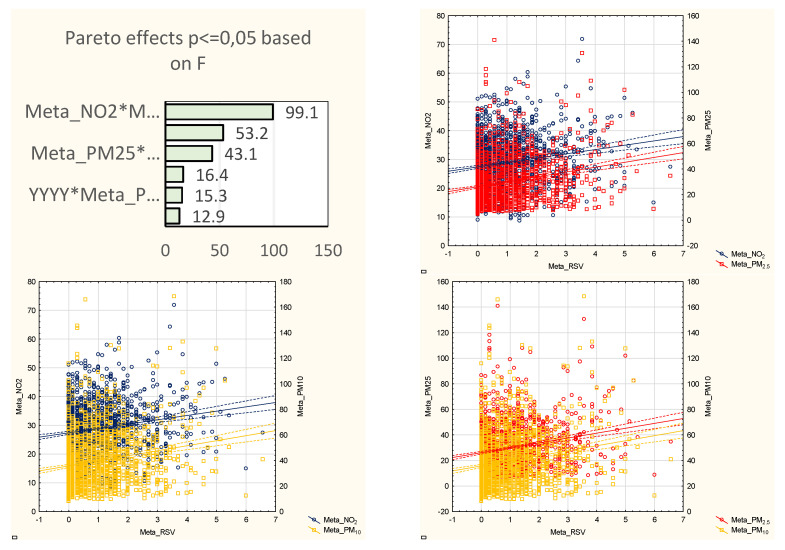
Figure 5.
Pareto chart of the effect power (based on the F statistics) in the metaregression and scatterplots of the interactions between the air pollutant concentrations and RSV hos pitalizations during the RSV high-risk season (2012–2019) in the metaregression. Abbreviations: Meta_PM2.5-PM2.5 in metaregression; Meta_PM10-PM10 in metaregression; Meta_NO2-NO2 in metaregression; Meta_NO2*Meta_PM2.5- interaction between NO2 and PM2.5; Meta_NO2*Meta_PM10- interaction between NO2 and PM10; Meta_PM2.5*Meta_PM10- interaction between PM2.5 and PM10; YYYY*Meta_PM2.5- interaction of the years of the study and PM2.5; YYYY*Meta_PM10- interaction of the years of the study and PM10; YYYY*Meta_NO2- interaction of the years of the study and NO2.

