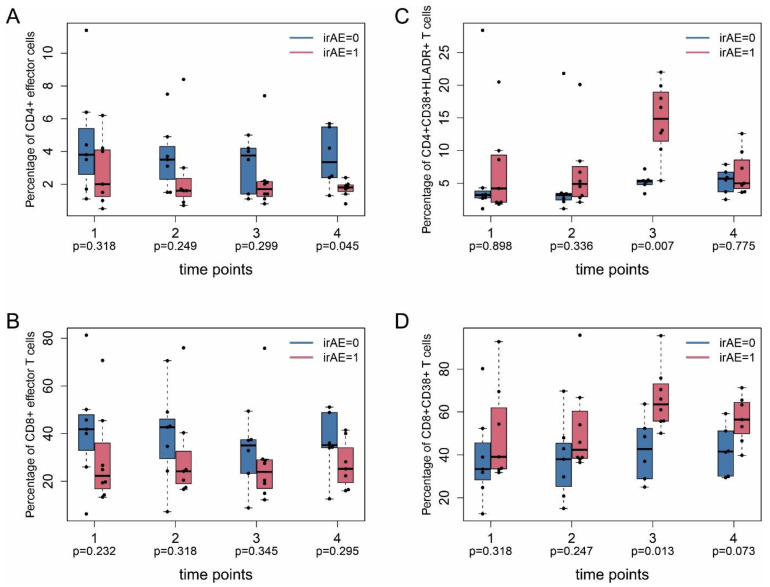
Figure 4.
Inflammatory T cell subpopulations in patients with and without irAE. PBMC were taken from patients at indicated time points as described in Figure 1 and analyzed by flow cytometry (FACS). (A,B) Percentage of CD4+ and CD8+ effector T cells. (C) CD4+CD38+HLADR+ T cells. (D) CD8+CD38+ T cells. irAE, immune-related adverse events. 0, without; 1, with adverse events. Nominal (unadjusted) p-values (Mann–Whitney U test between irAE = 1 and irAE = 0) are shown without adjustment for multiple testing. Data in (A,B) are given as percentage of CD4+ effector cells and CD8+ effector cells, respectively, of total CD4+ and CD8+ cells. Data in (C) are given as percentage of CD38+HLADR+ cells of total CD4+ cells. Data in (D) are given as percentage of CD38+ cells of total CD8+ cells.

